Psychometric Analysis

INFO 526 - Spring 2024 - Project 1

Team Byte Coders- Mobolaji Adewale, Srinivasan Poonkundran, Tanya Evita George, Rohit Vatsava Kalakala, Noureen Mithaigar

Understanding the Dataset

  • It is a combination of about 890 characters from 100 different universes across pop culture, media and entertainment.
  • The dataset is a compilation of the results of several personality tests taken by different users.
  • It consists of a total of 400 different personality questions out of which, the most commonly occurring ones have been categorized into groups.

  • The whole dataset consists of three DataFrames:
    • “character”: Includes high level information including a notability score about each character.
    • “psych_stats”: Consist data on personality/psychometric stats per character.
    • “myers_briggs”: Test users self-identified their Myers-Briggs types.

Question 1:

How do Myers-Briggs personality types distribute across different universes, and how does the average match percentage vary within each universe? Additionally, is there any correlation between character notability scores and their Myers-Briggs types within each universe?

Question 1 - Part 1

The number of characters that hold the highest correlation to a respective Myers-Briggs personality type:

The number of characters that hold that highest correlation to a Myers-Briggs type:
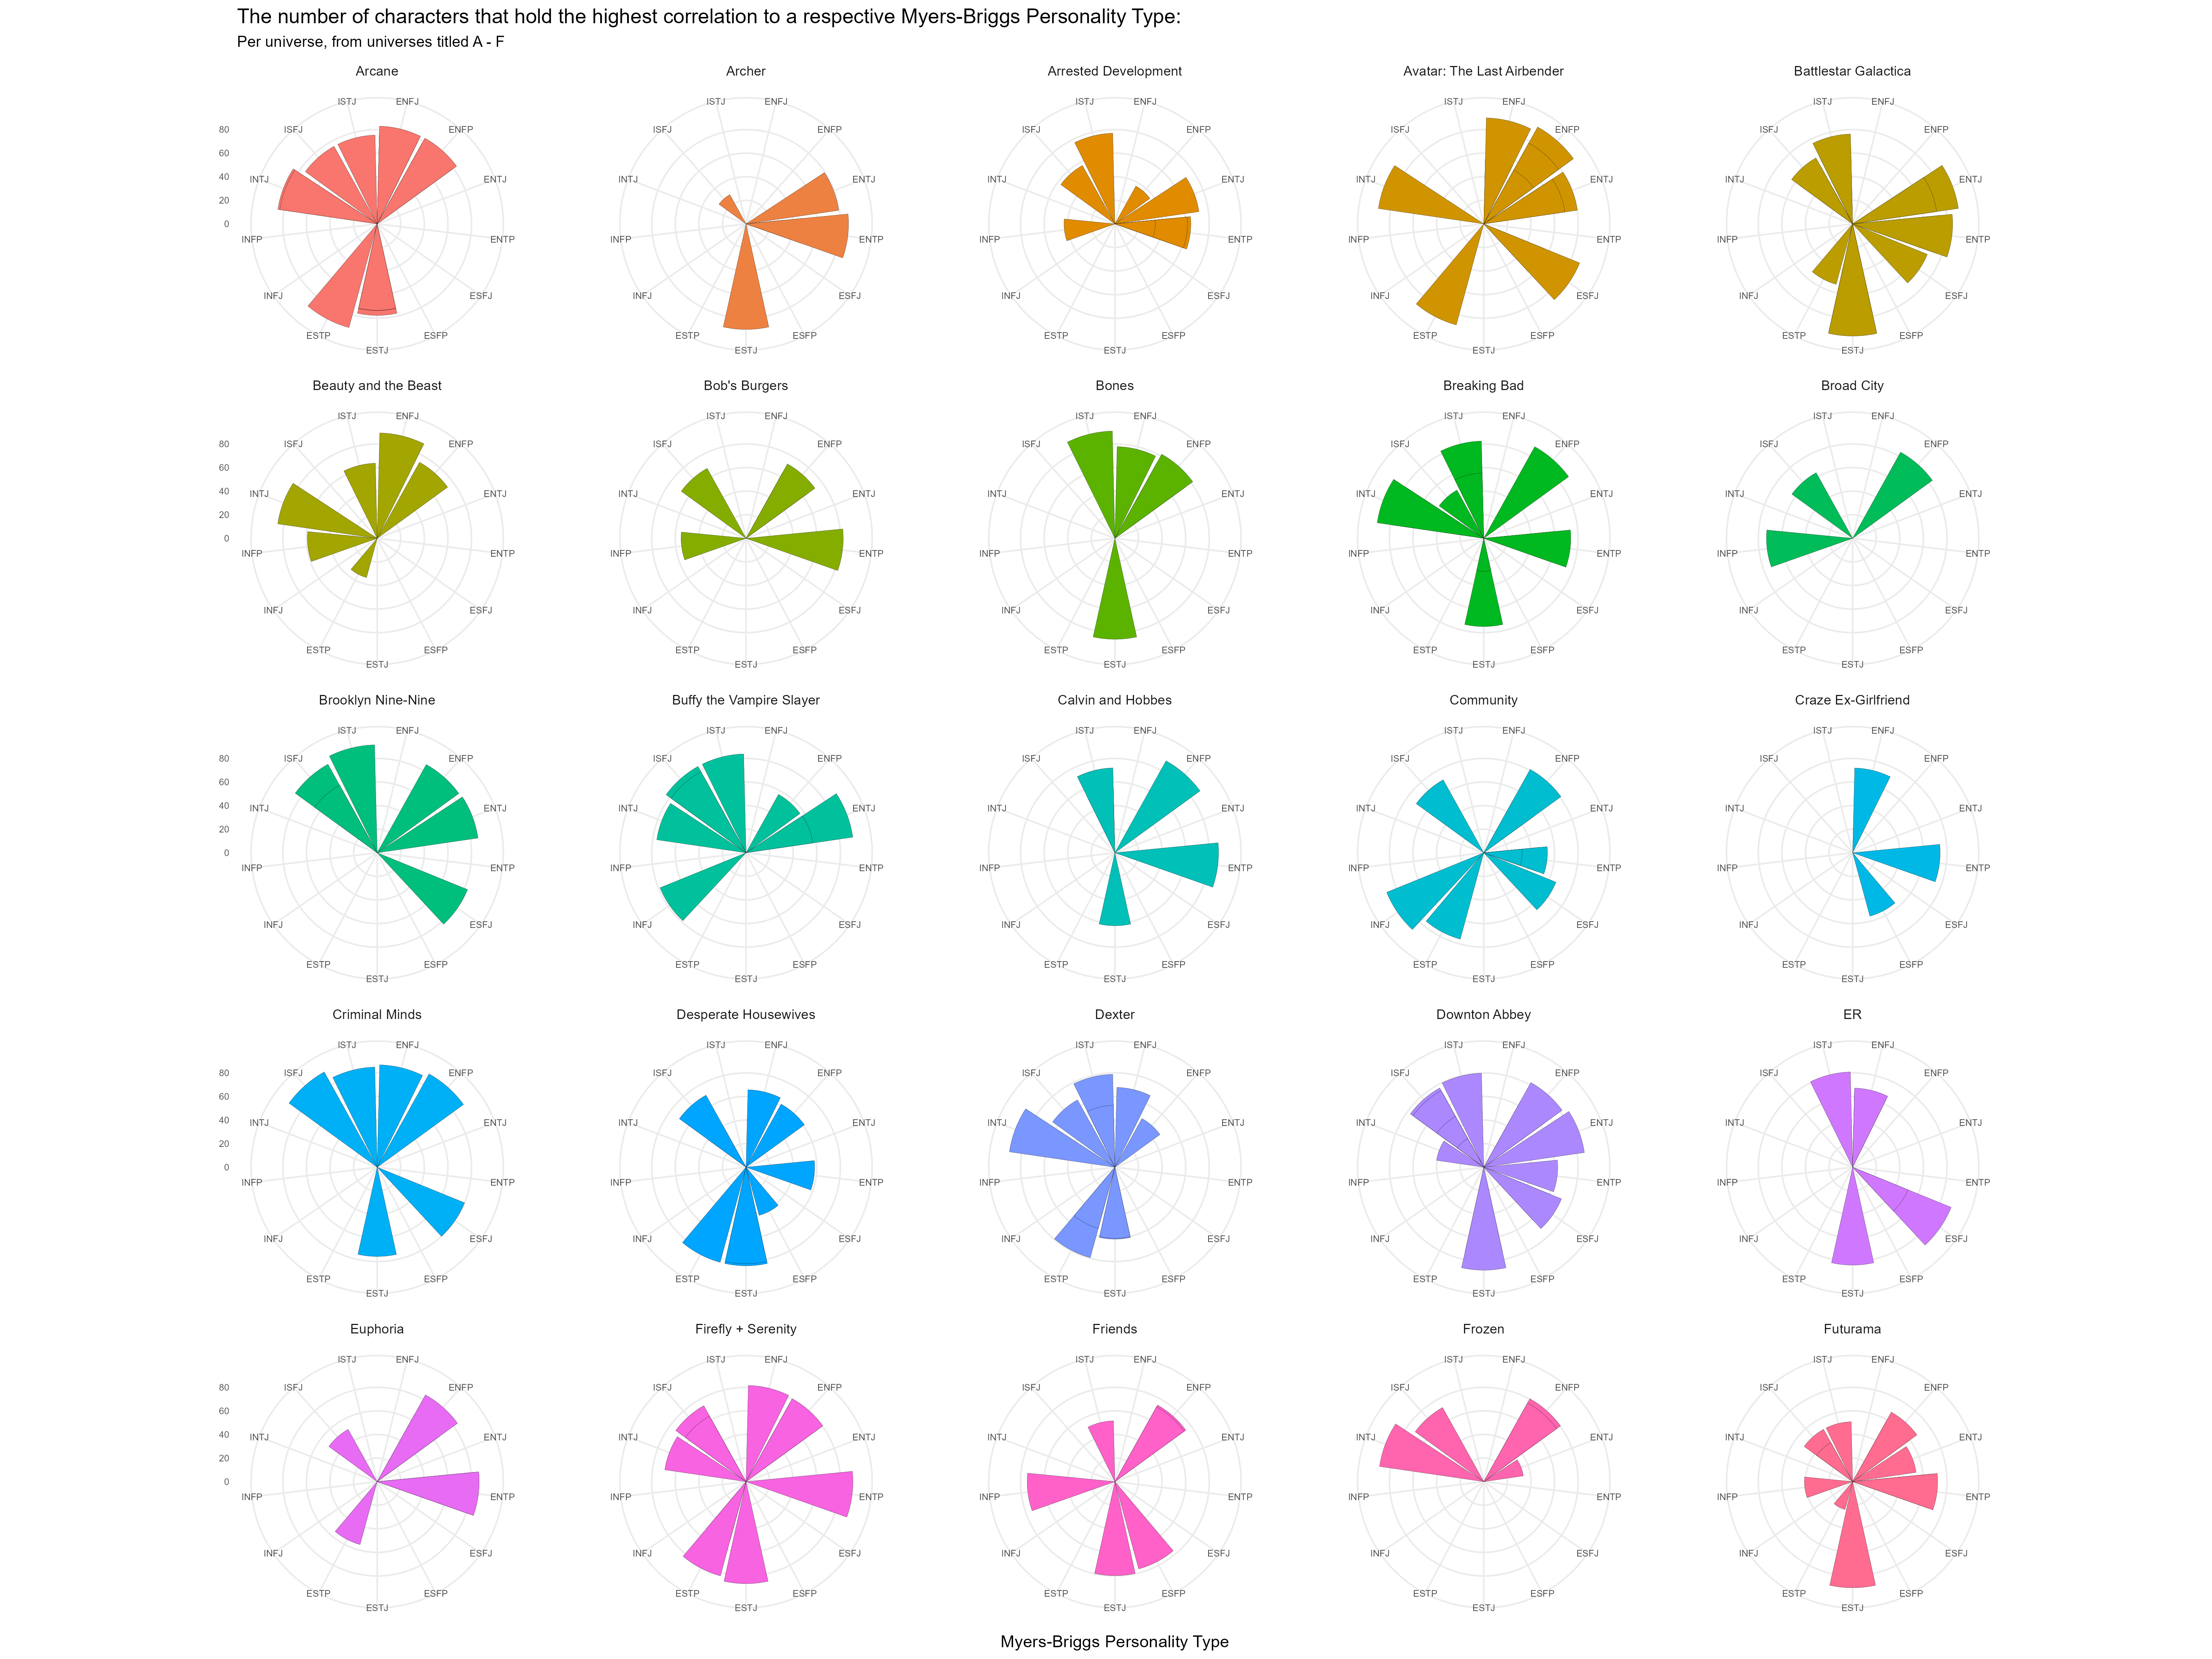
  • The plot highlights the vast differences between Myers-Briggs personality type occurrences in different universes.
  • To exemplify, “Buffy the Vampire Slayer” has a larger amount of introverted characters than extroverted which contrasts with “Downton Abbey” which appears to contain more extroverted characters than introverted.
  • This could allow for inferences concerning whether specific genres of media are inherently built with introverted or extroverted characters (i.e. action should presumably comprise of more extroverts).

Question 1 - Part 2

Notability scores of each character in The Walking Dead by personality type:

Notability scores of each character in The Game of Thrones by personality type:
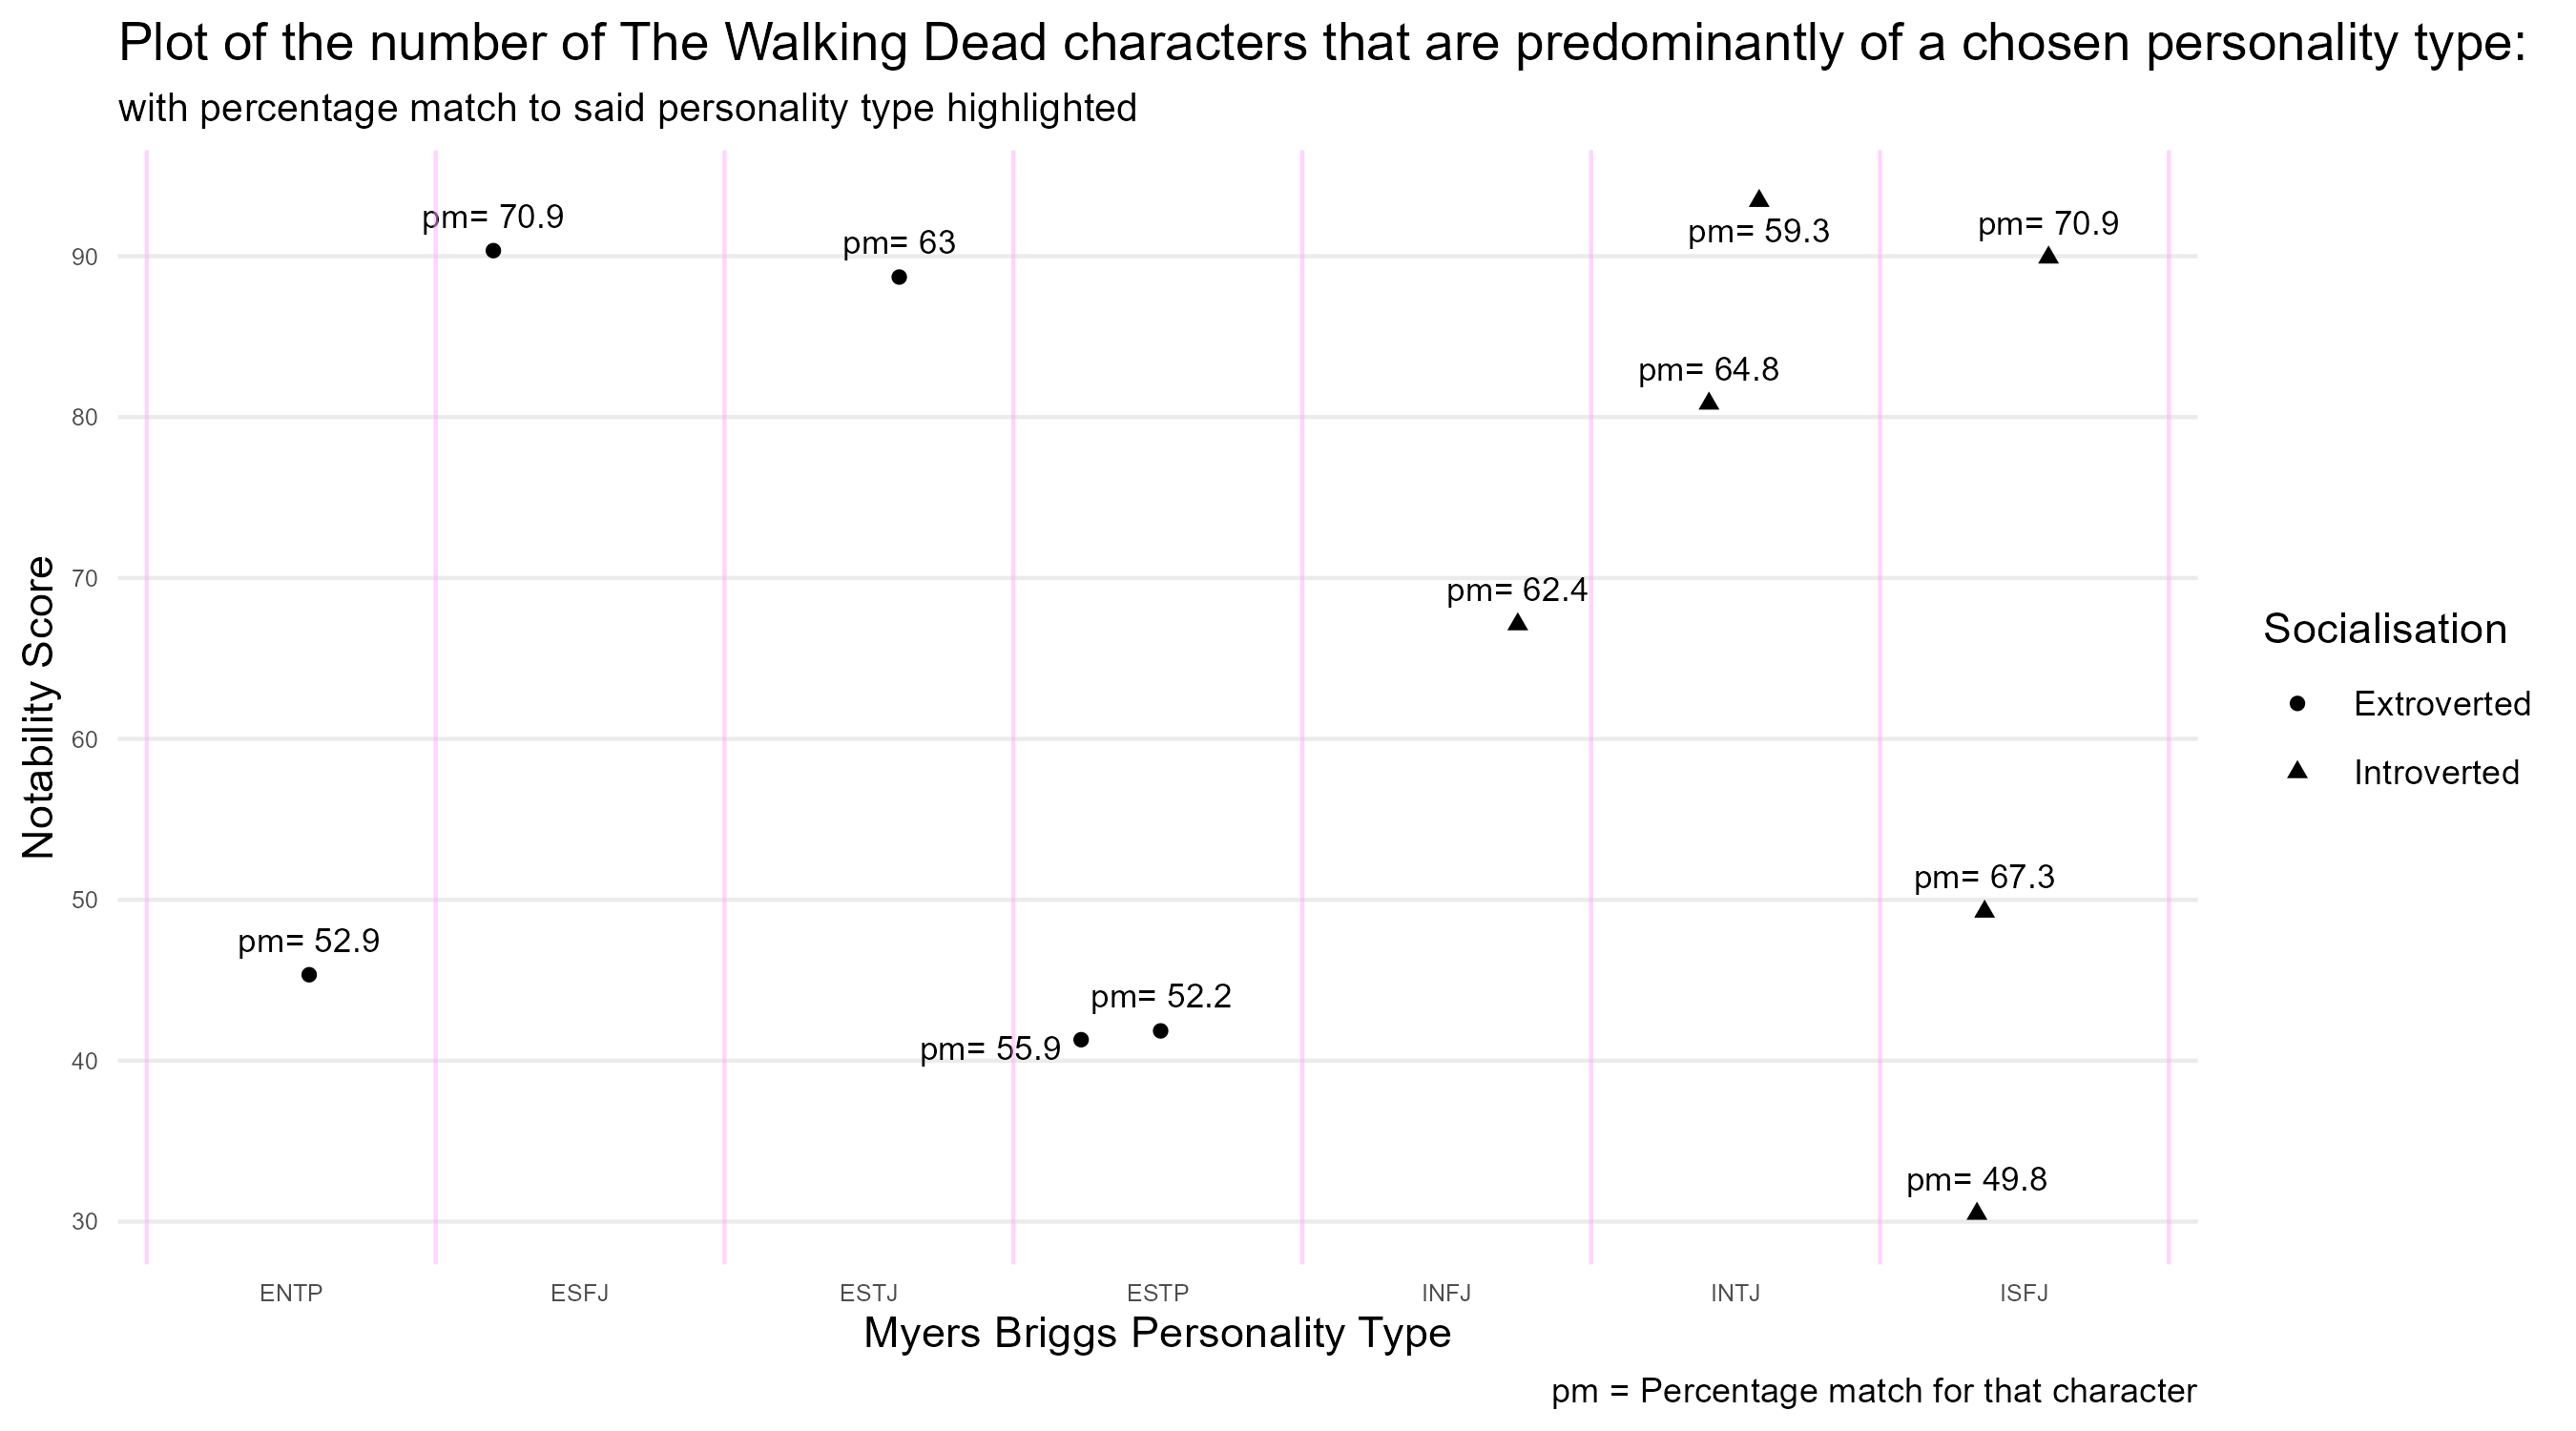
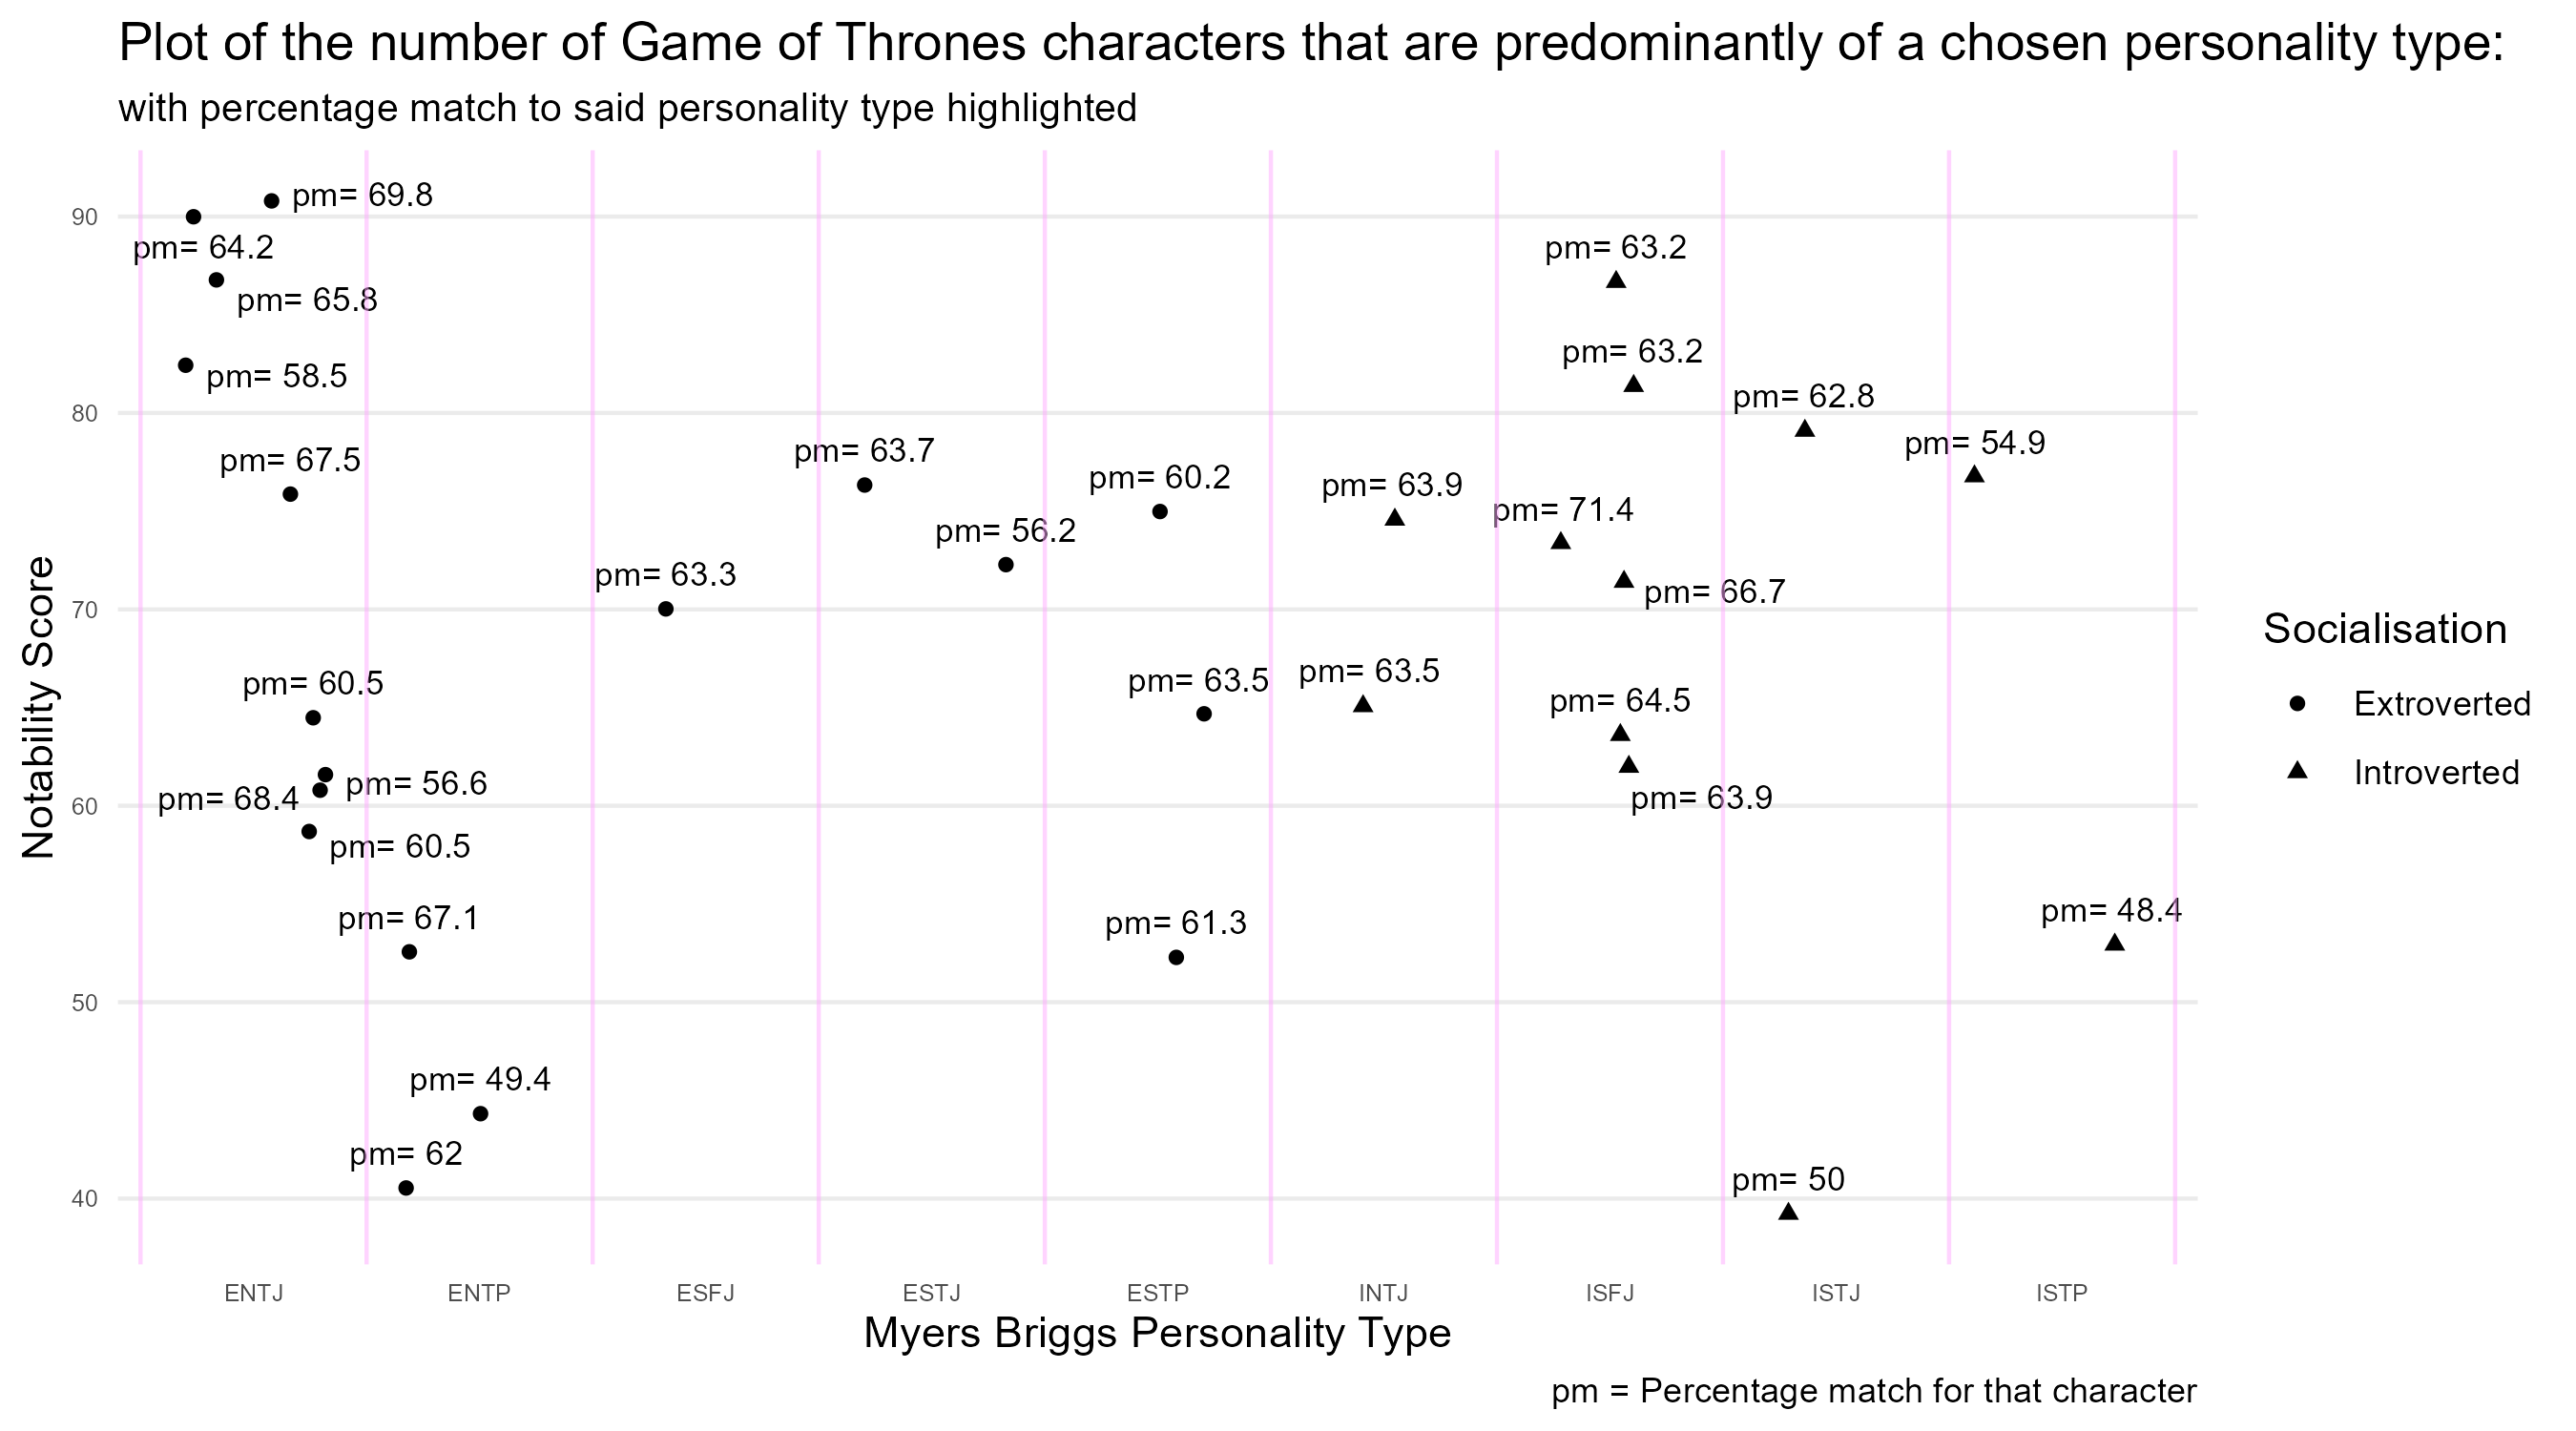
  • Shows the notability scores for each character within their universe, grouped by their dominant personality type.
  • The plot includes the percentage match value: which is by how much the character matches their dominant personality type - a confidence rating of sorts.
  • From this information one can infer that: as only one character has a percentage match > 70%, most characters do not entirely fit into one set personality type.

Question 1 - Part 3

Notability mean in The Walking Dead by personality type:

Notability mean in The Game of Thrones by personality type:
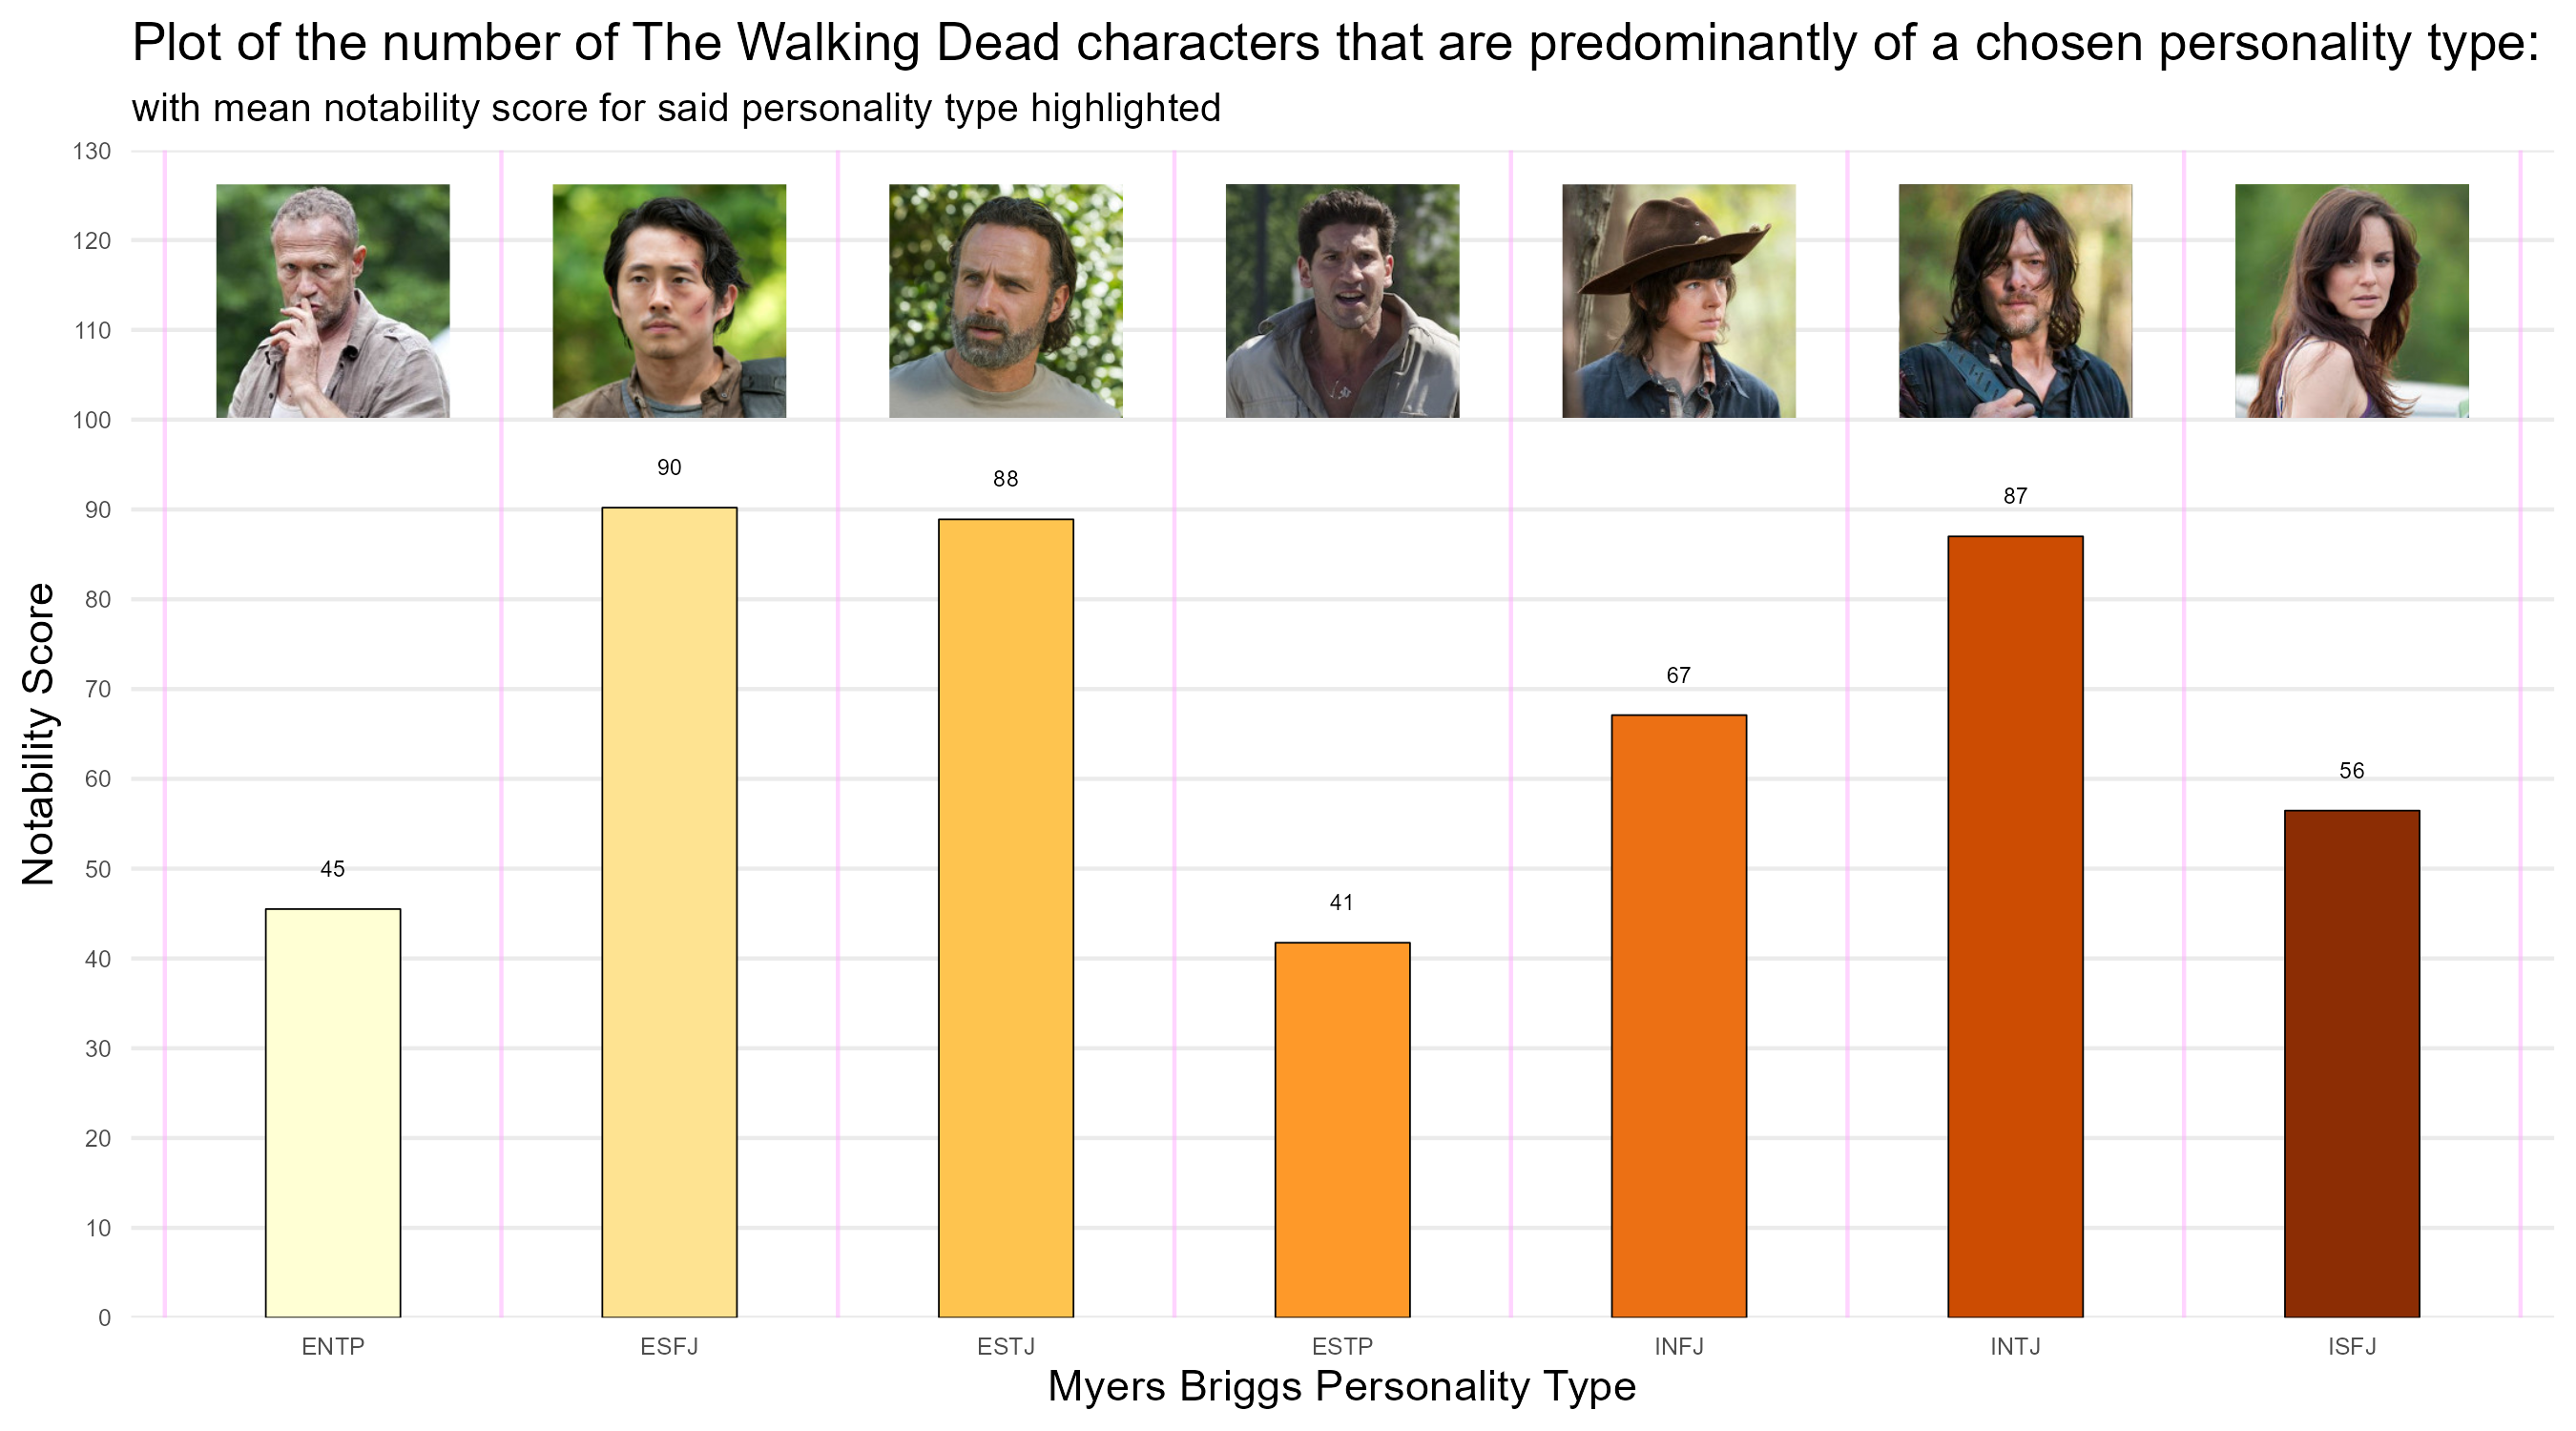
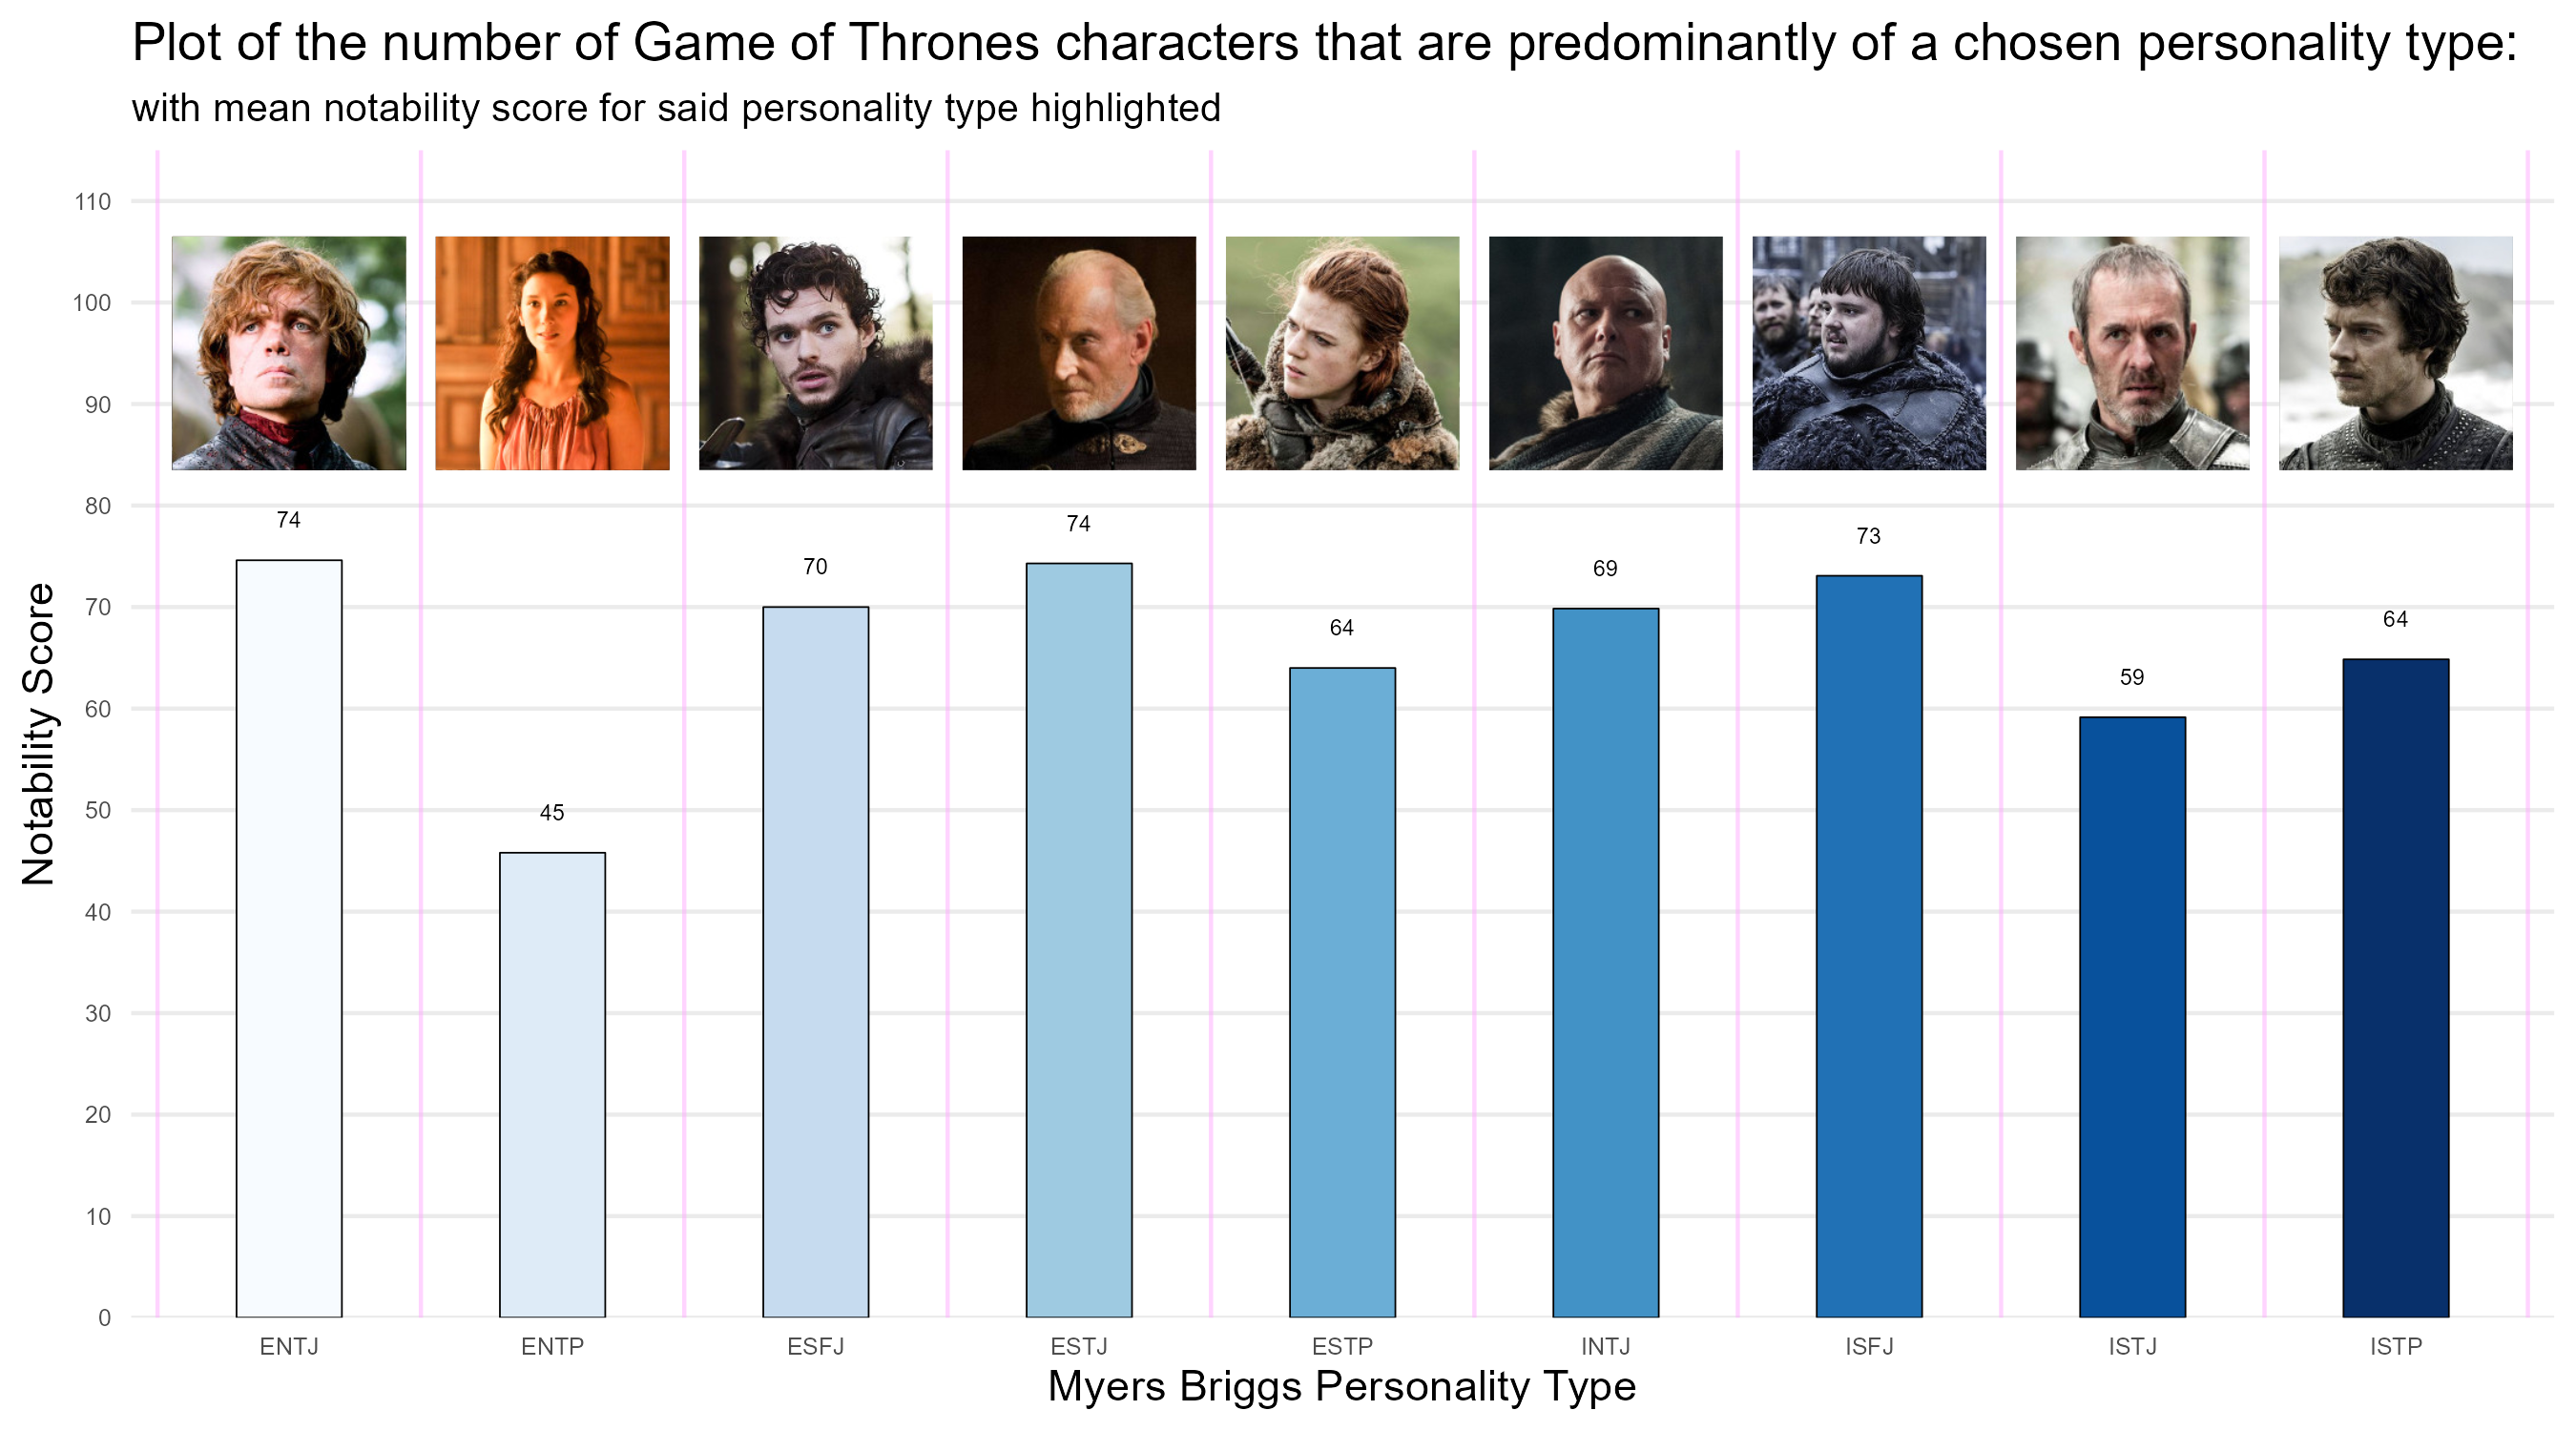
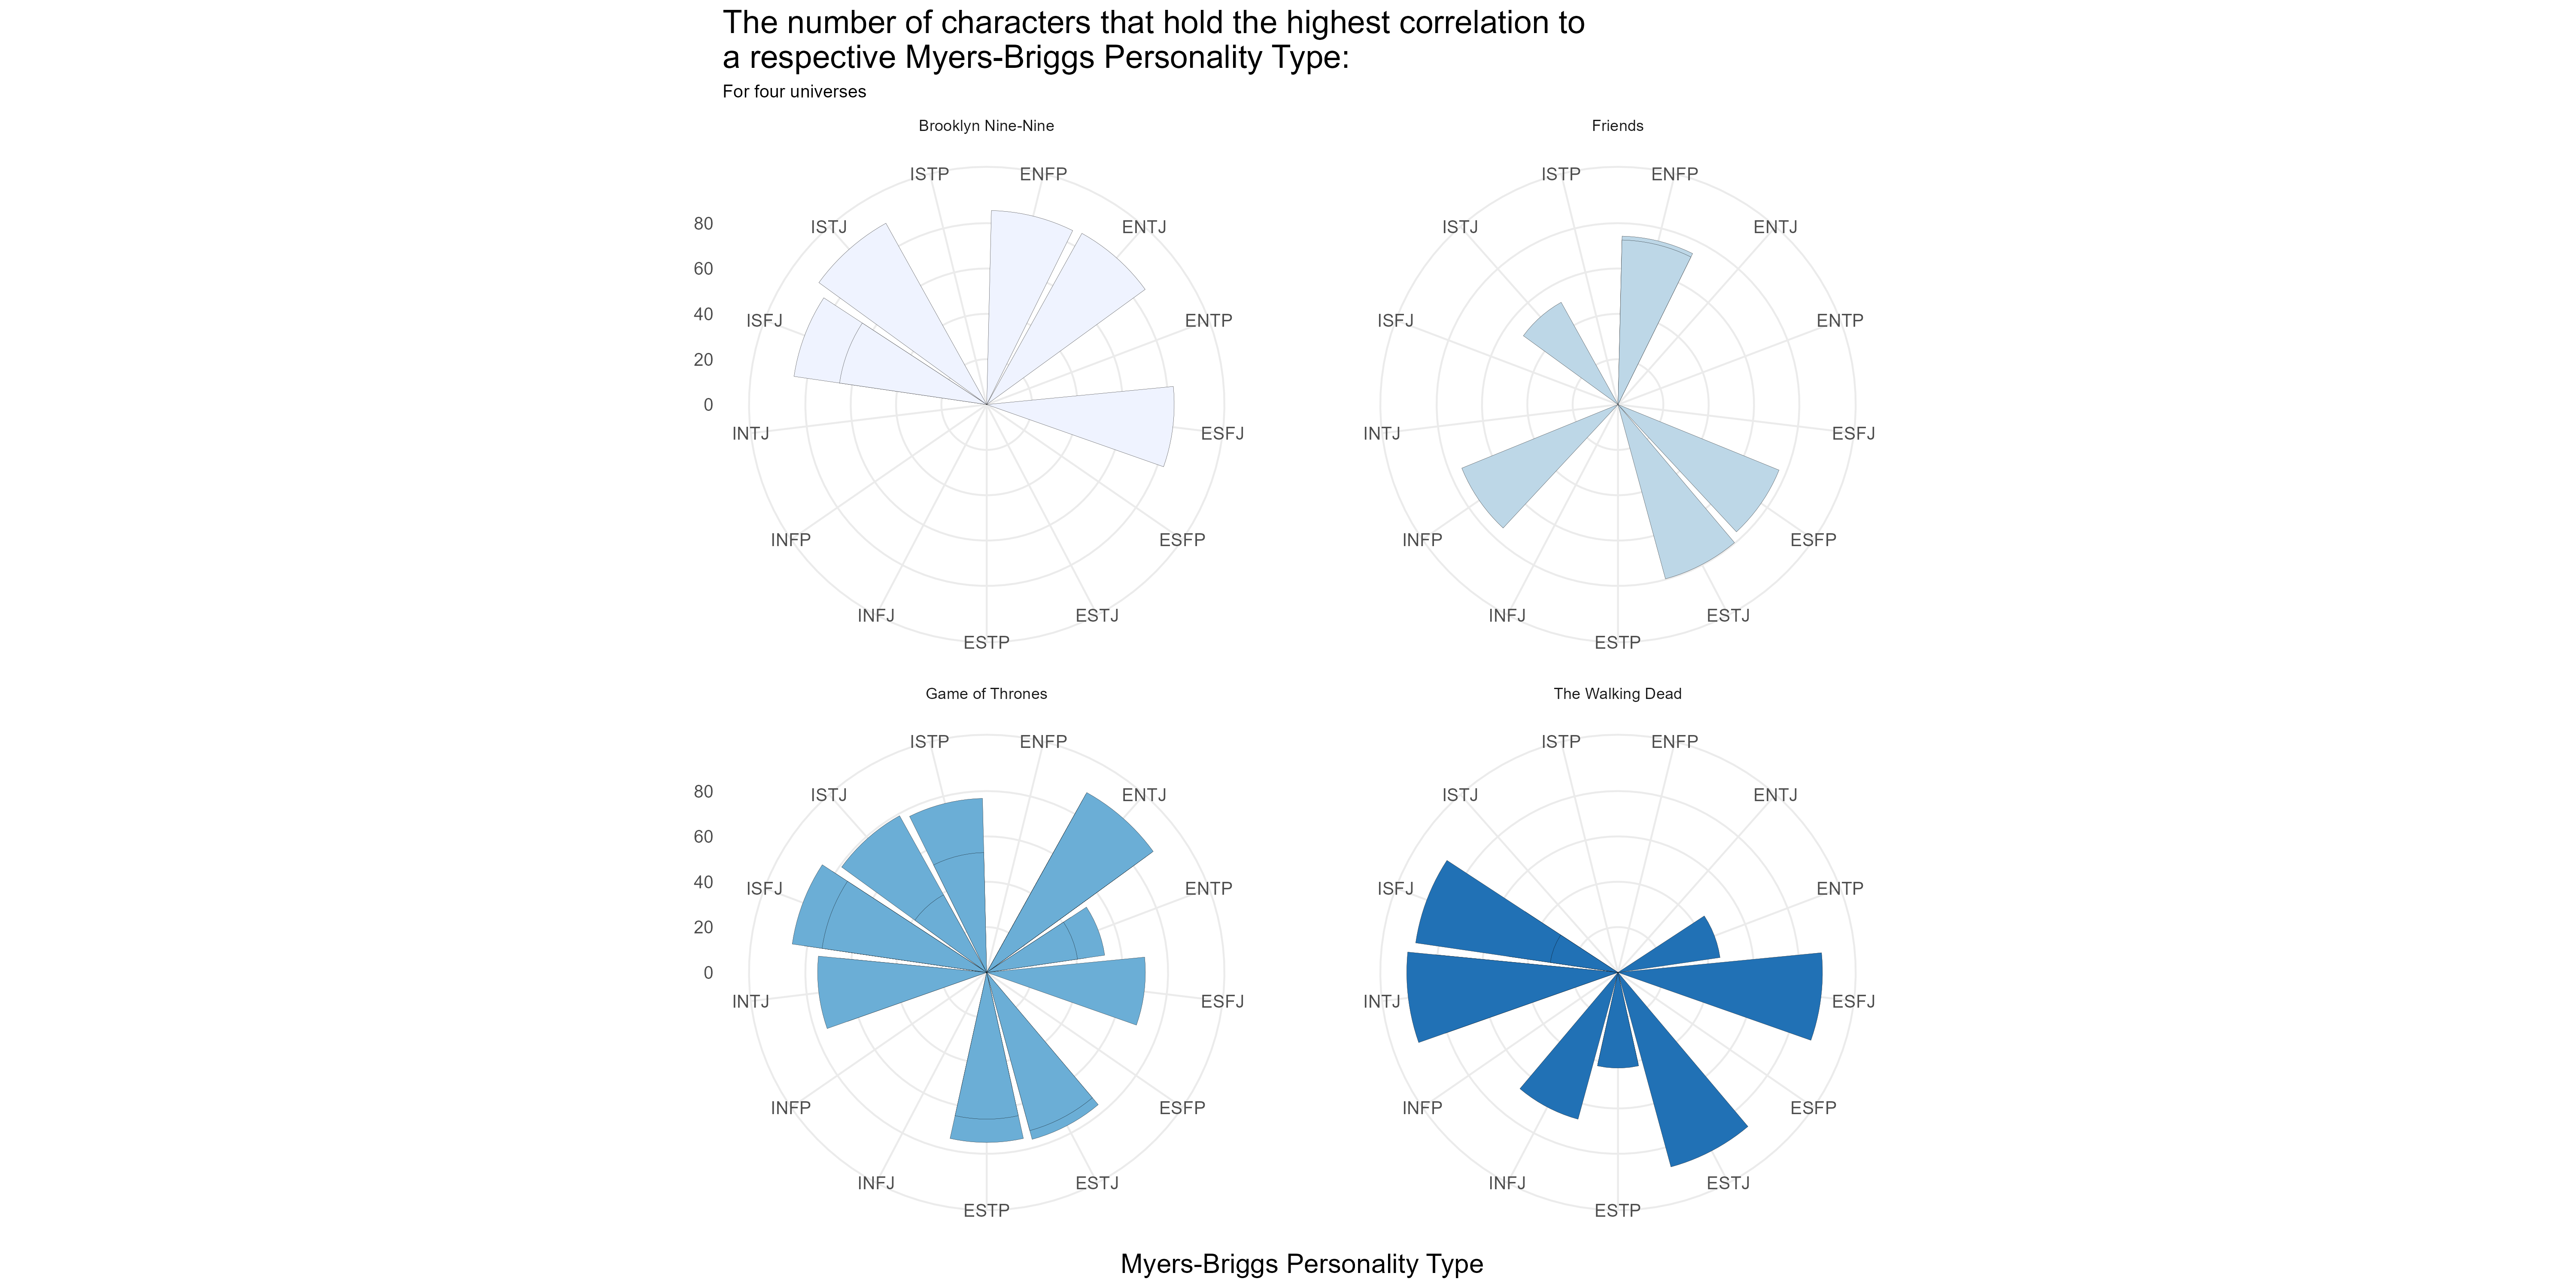
  • The mean notability scores per personality type, which provides valuable information on universe’s and how their characters are portrayed
  • The most notable The Walking Dead characters, on average, are of the type ESJF (Extroverted, Observant, Feeling and Judging): commonly known as consuls, who prefer to include others in everything they do
  • Noticeable from Game of Thrones is the apparent notability of almost every personality type, which could be a testament good character portrayal on-screen

Question 1 - Part 4

Mean notability of personality types, by television network:
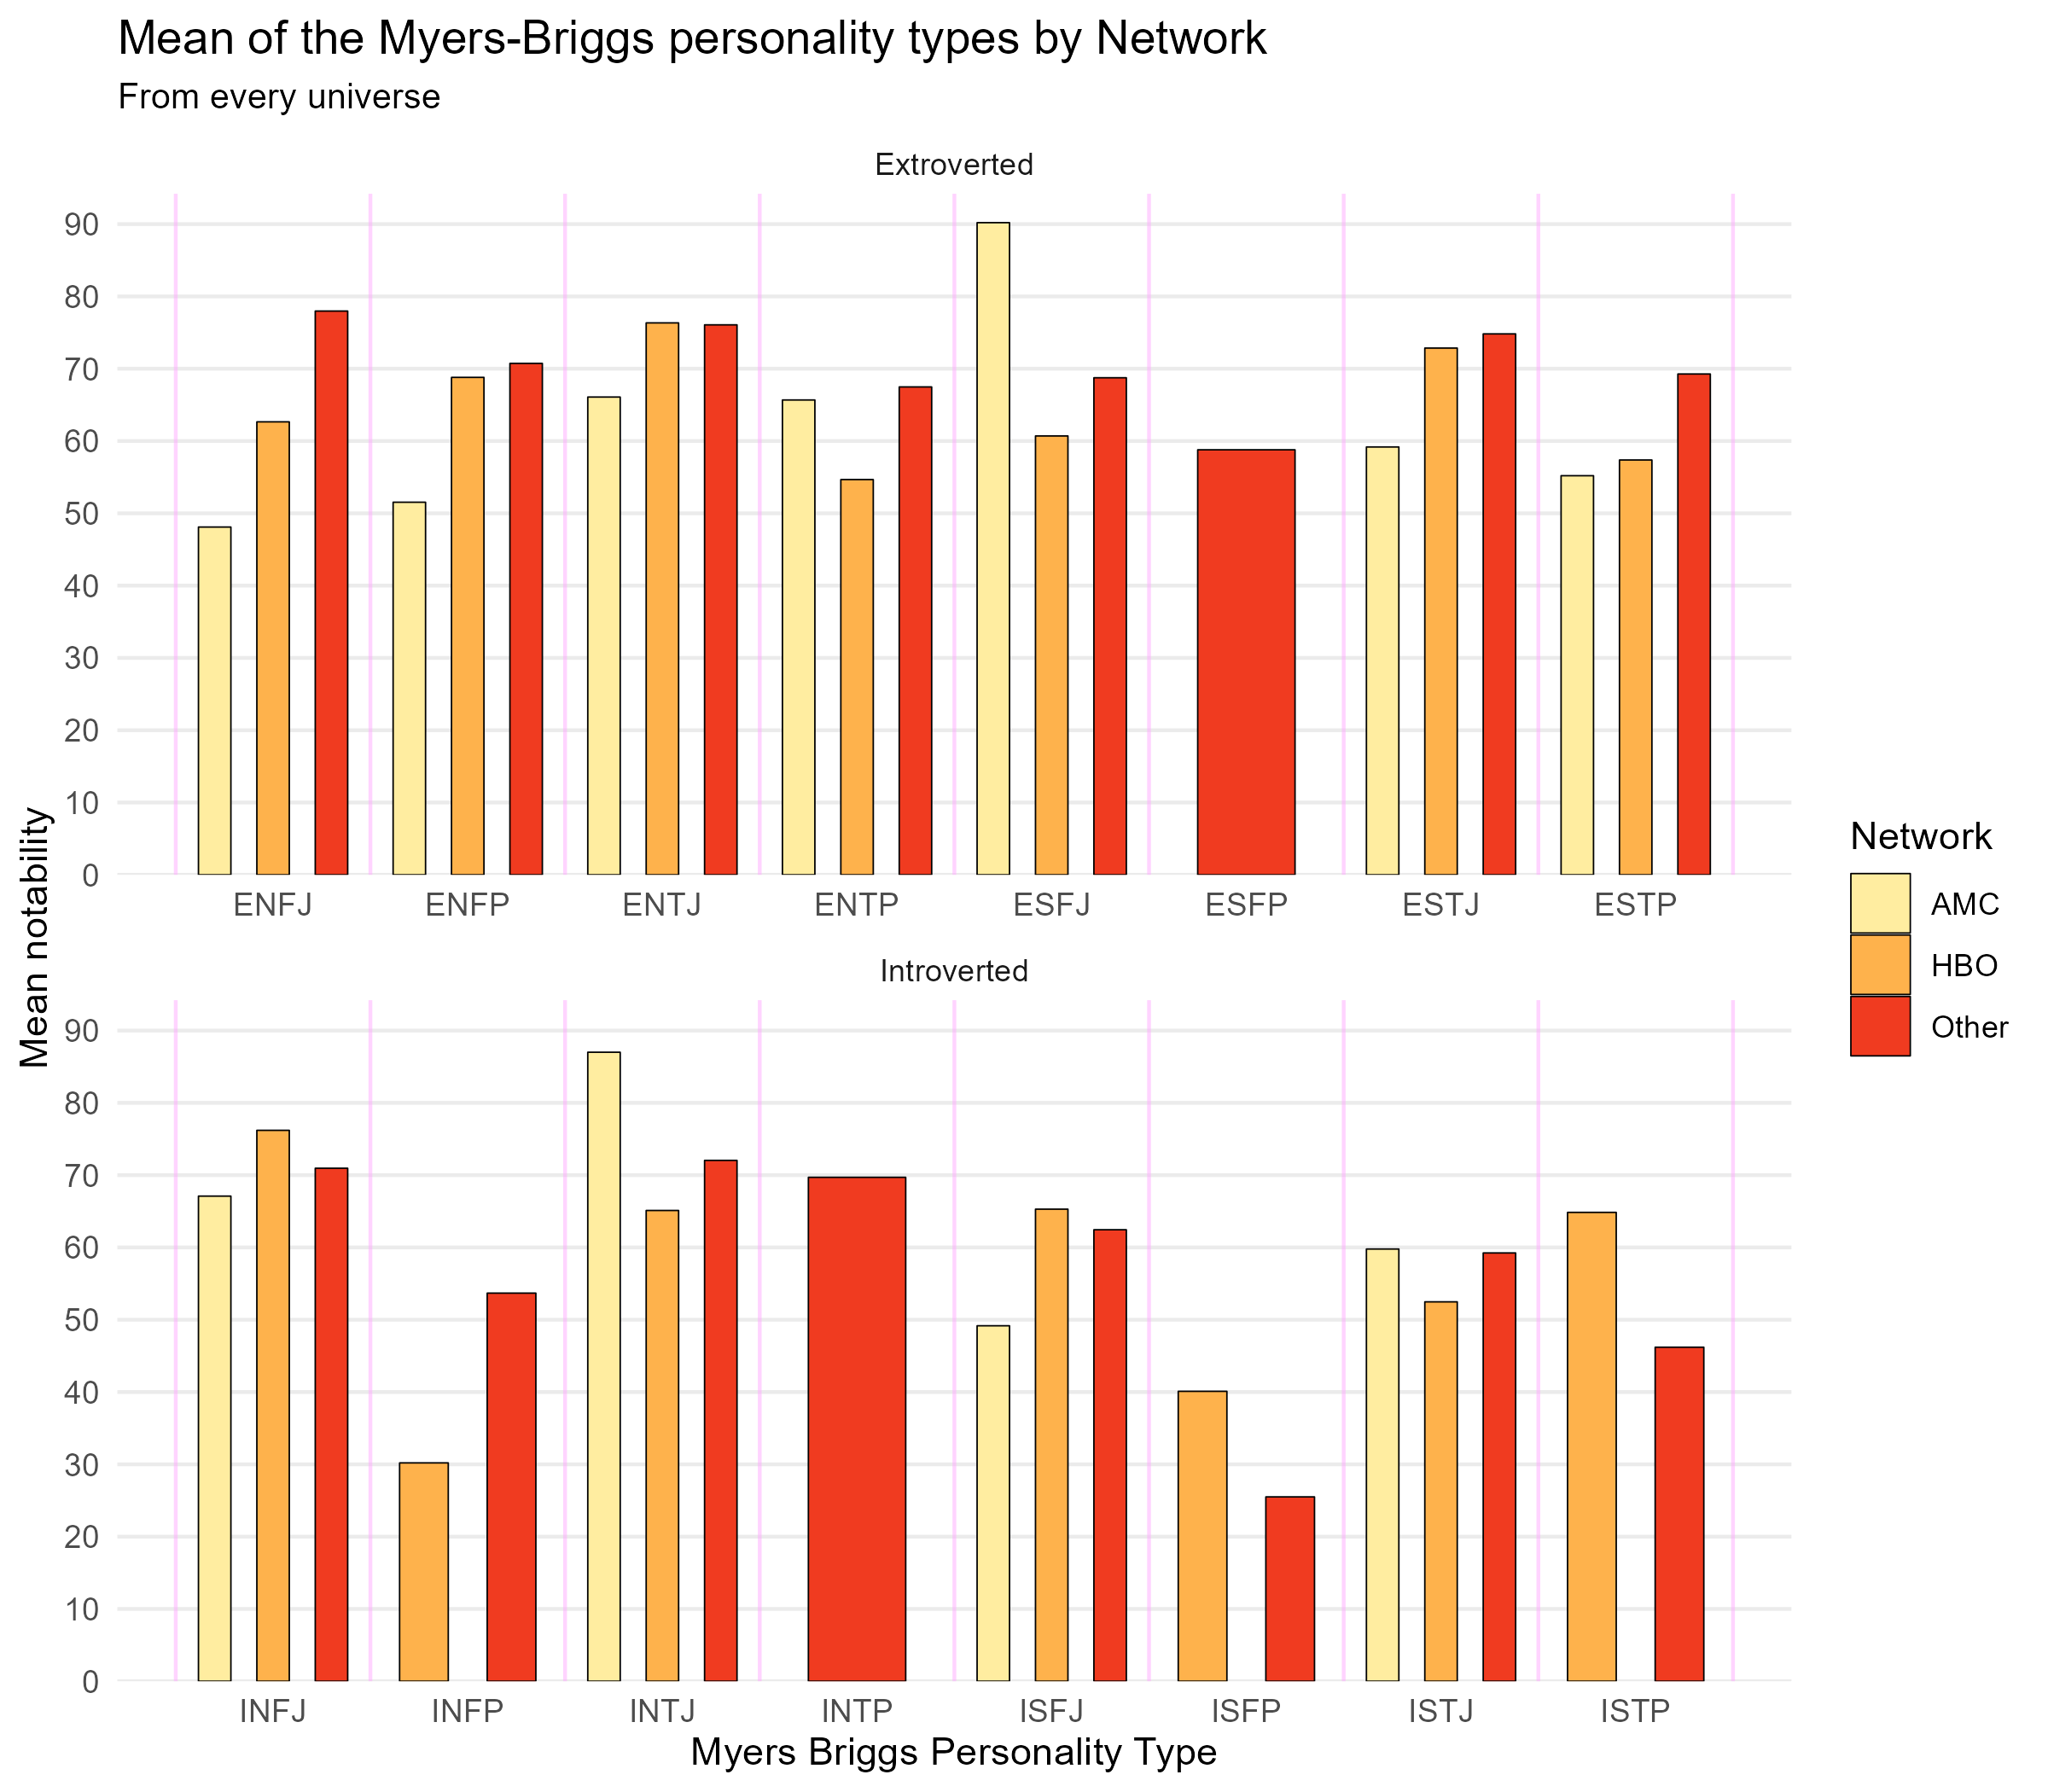
  • The seperation of means into television networks provides interesting insights
  • For starters: AMC and HBO fail to represent every single major personality type across all of their shows
  • Also, HBO produces more notable characters amongst those that are both Introverted and Judging, but fails at producing characters that prospect (deal with problems only as they arise) well

Question 2:

What is the frequency distribution of character personality traits across all characters, and how does it correlate with their average rating? Furthermore, do character notability scores vary significantly based on their personality traits?

Question 2 - Part 1

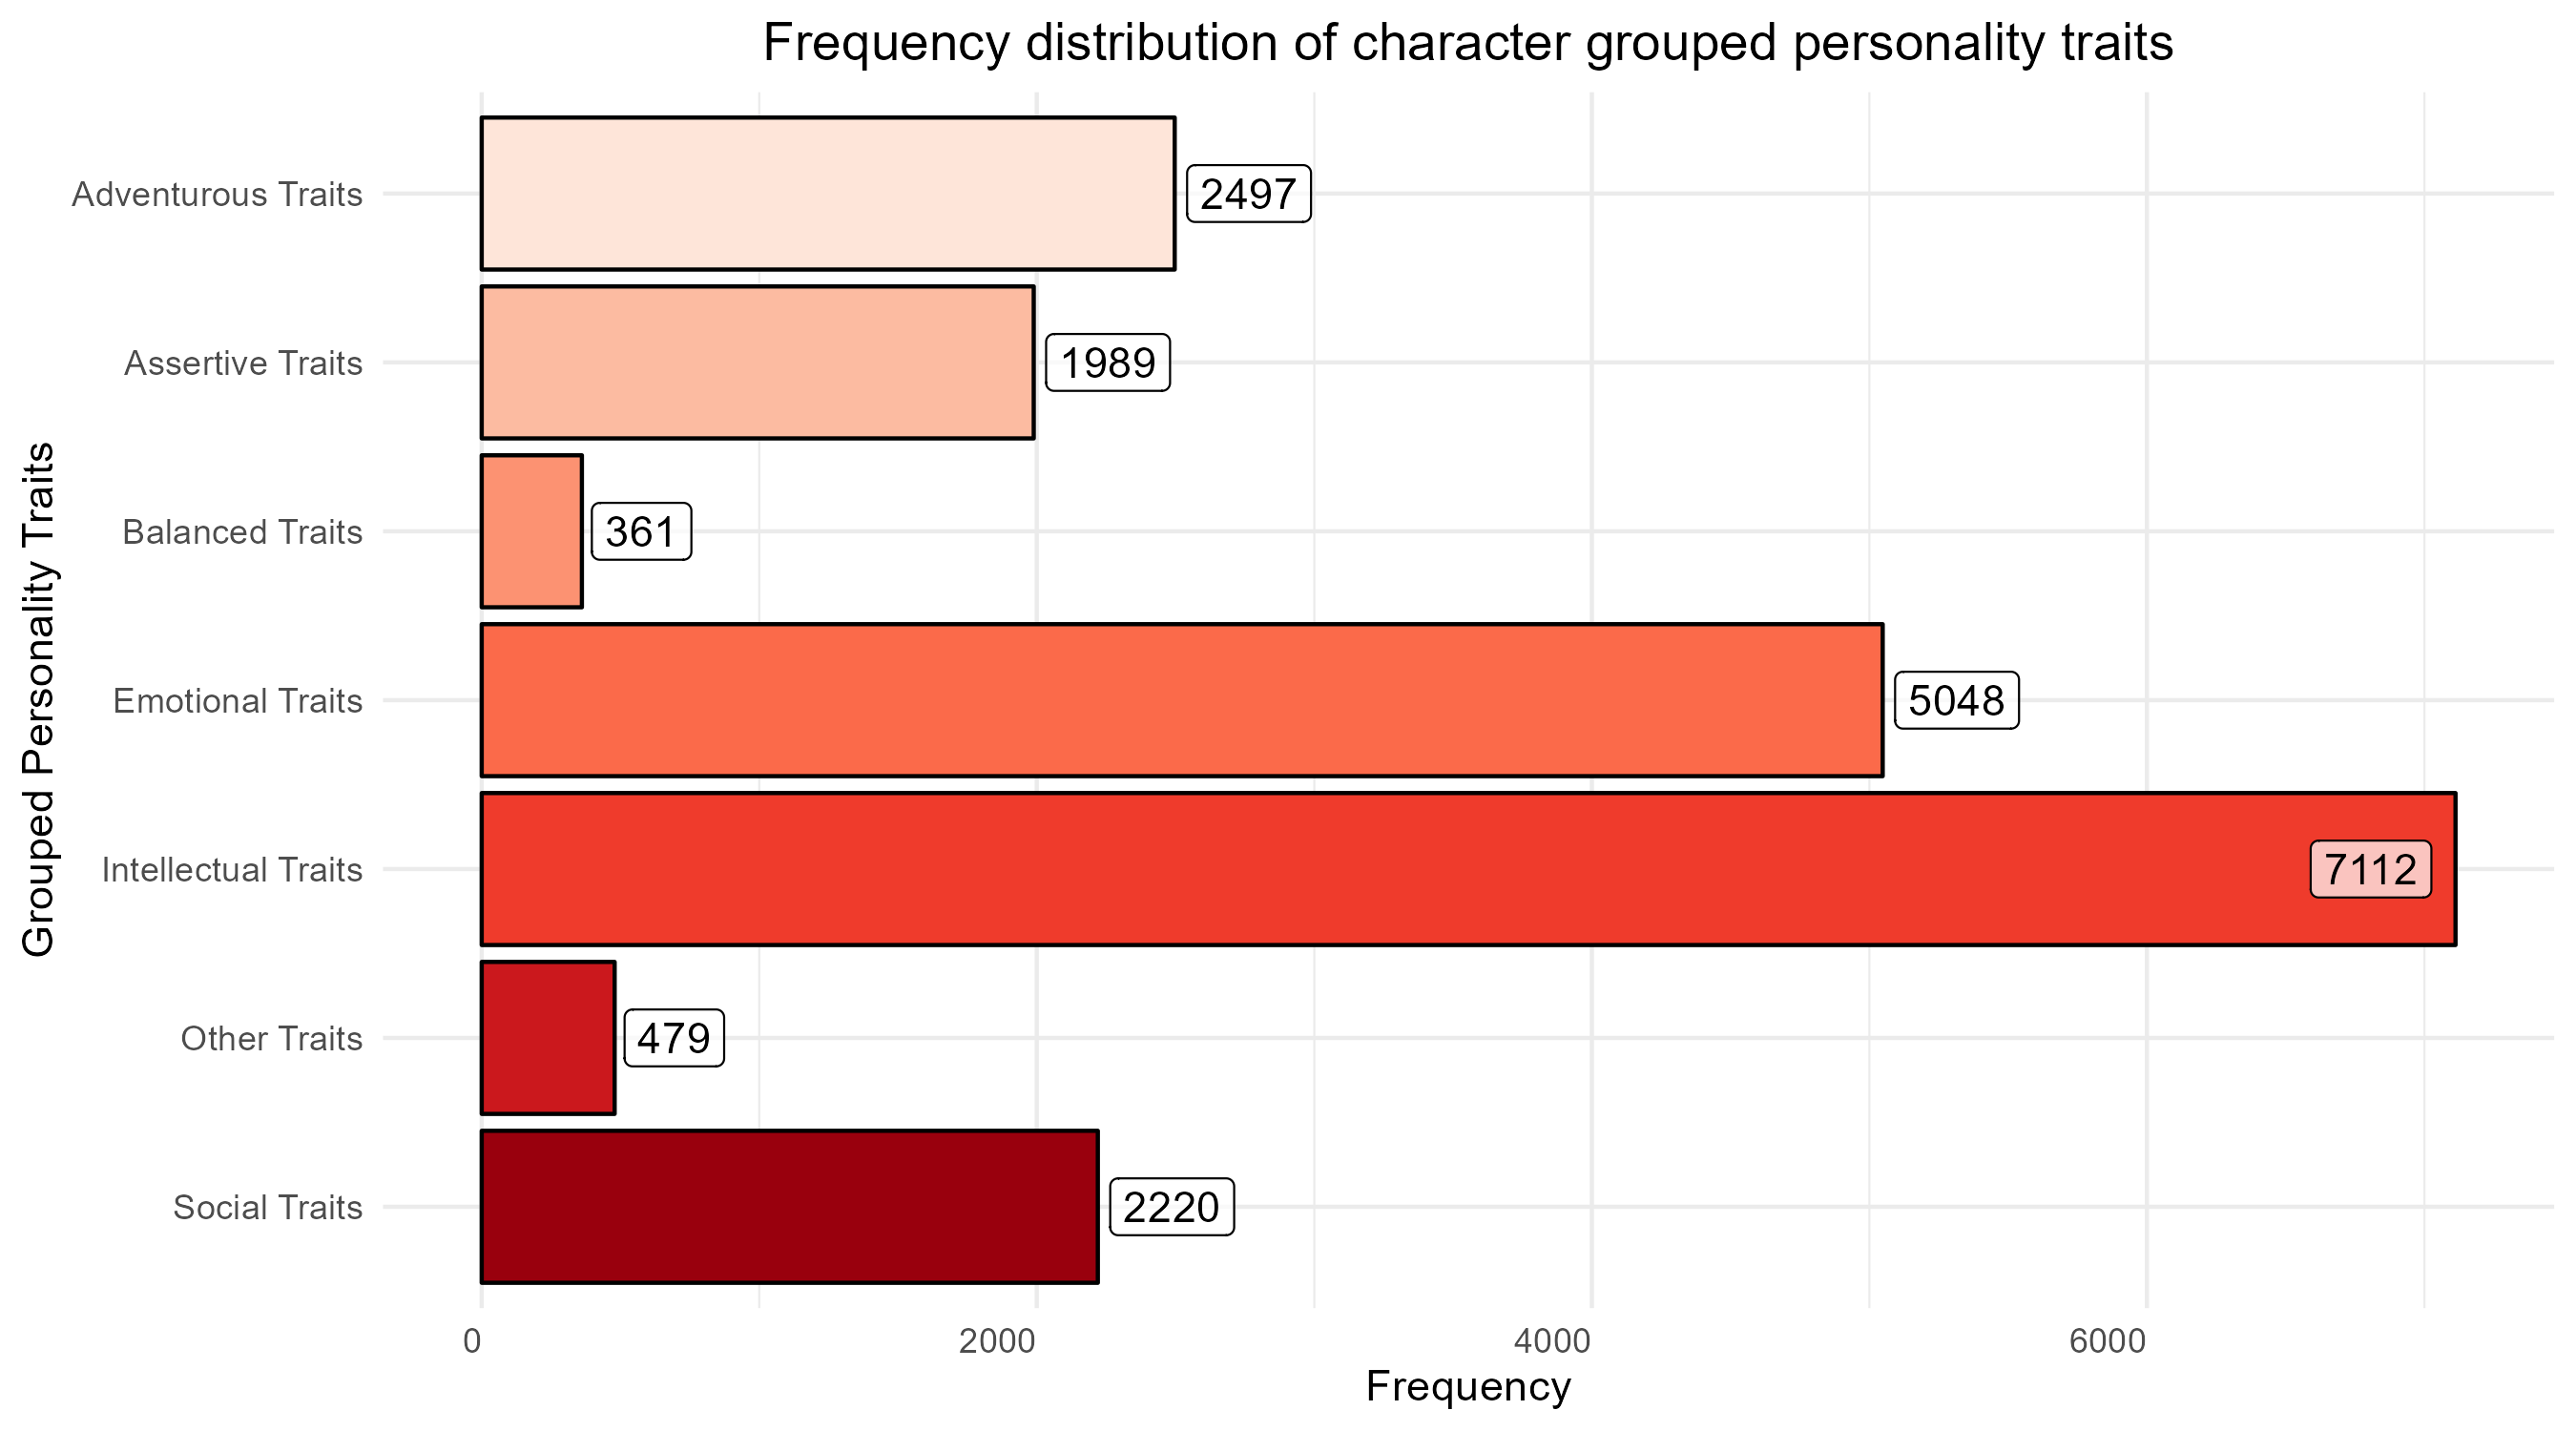
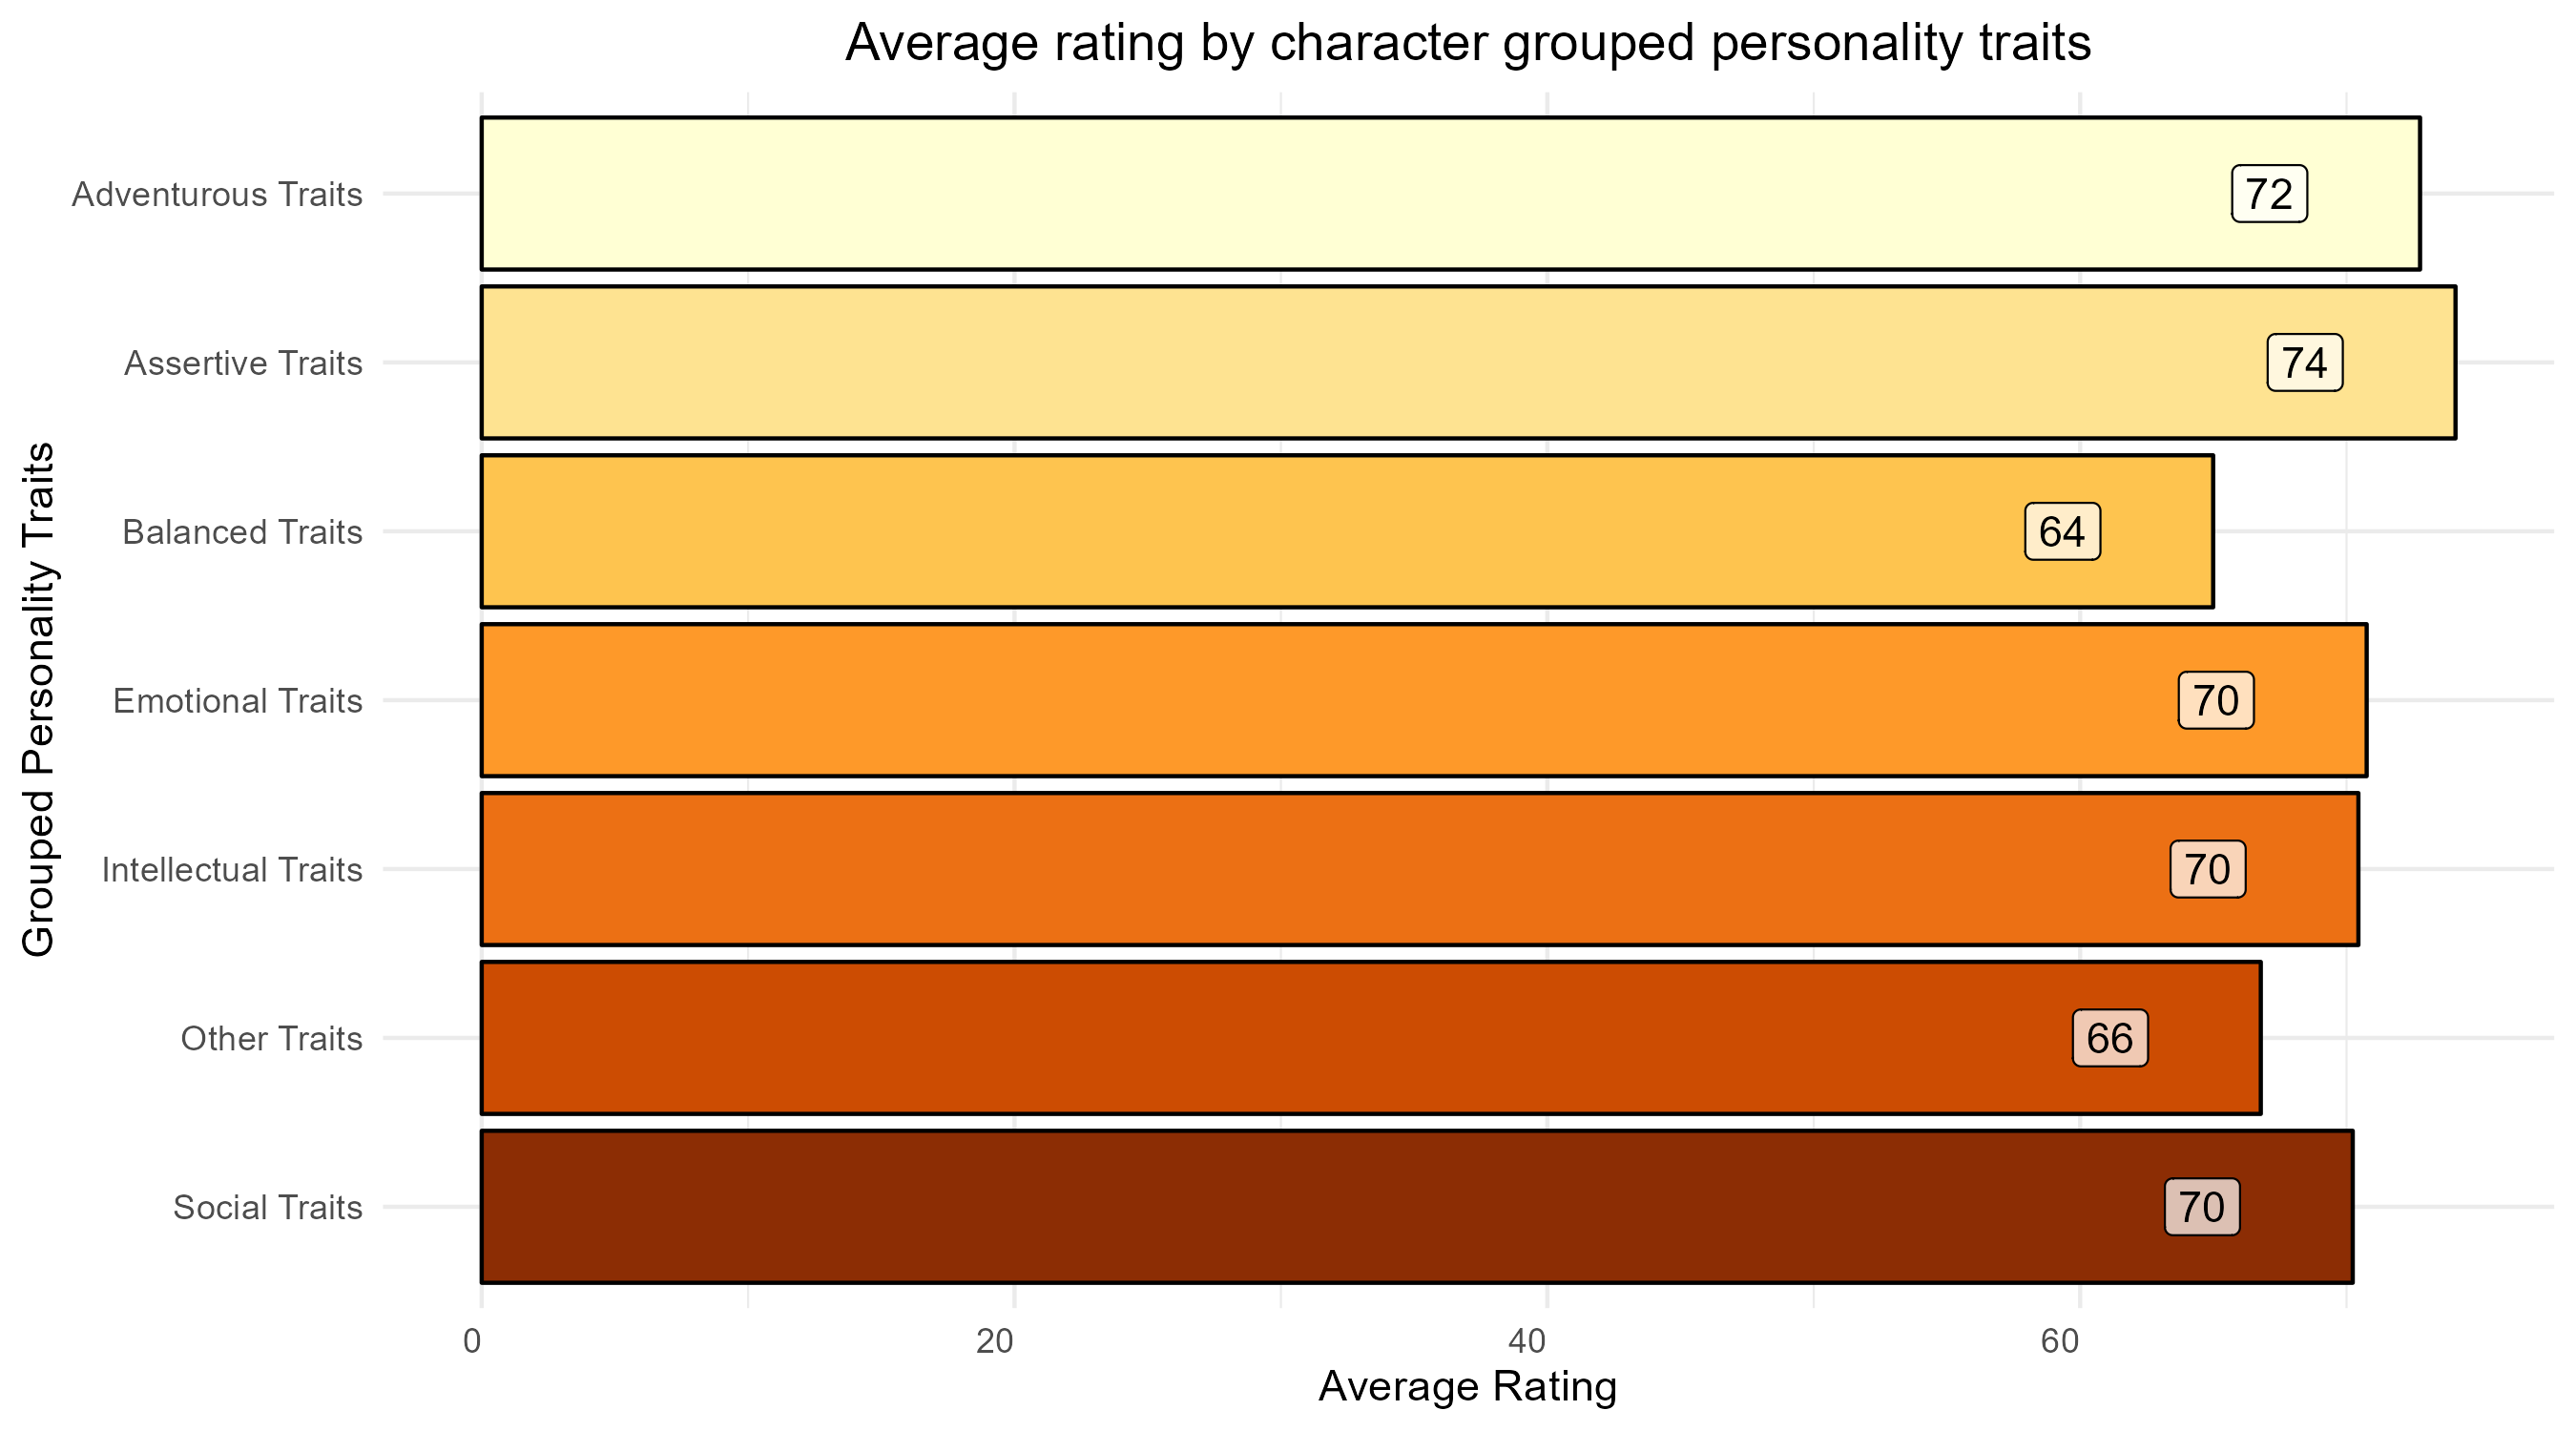
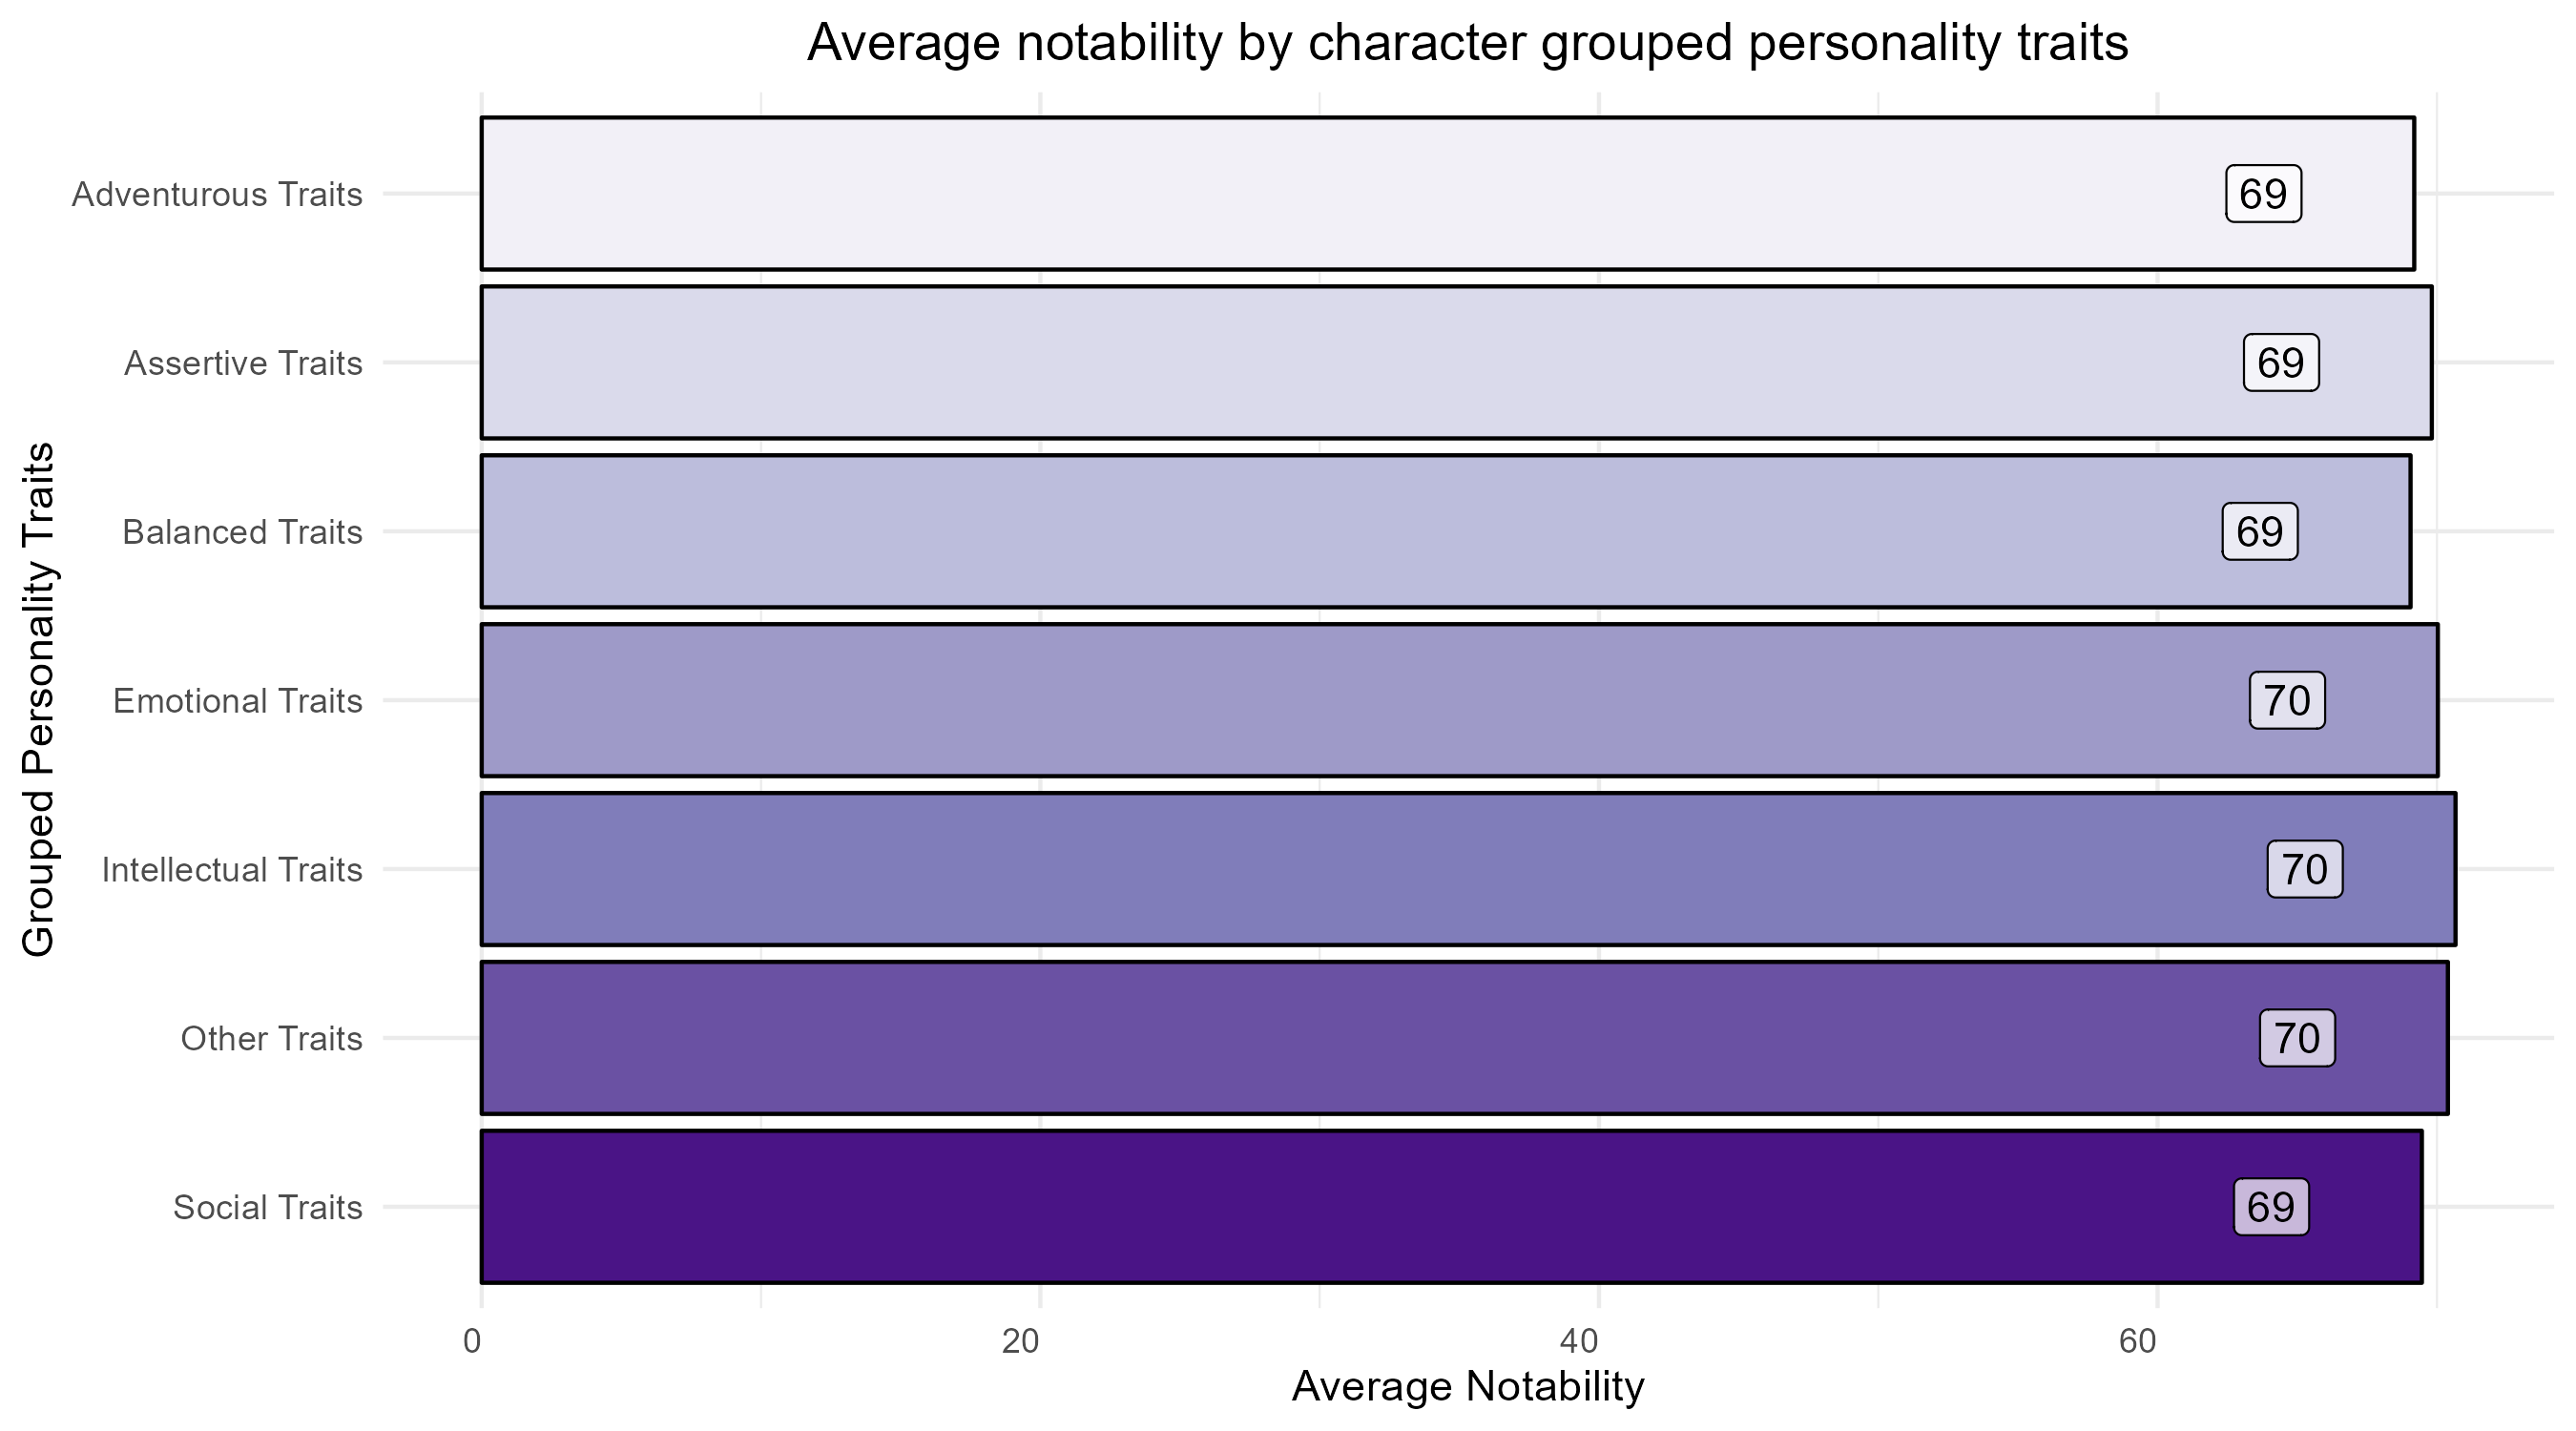
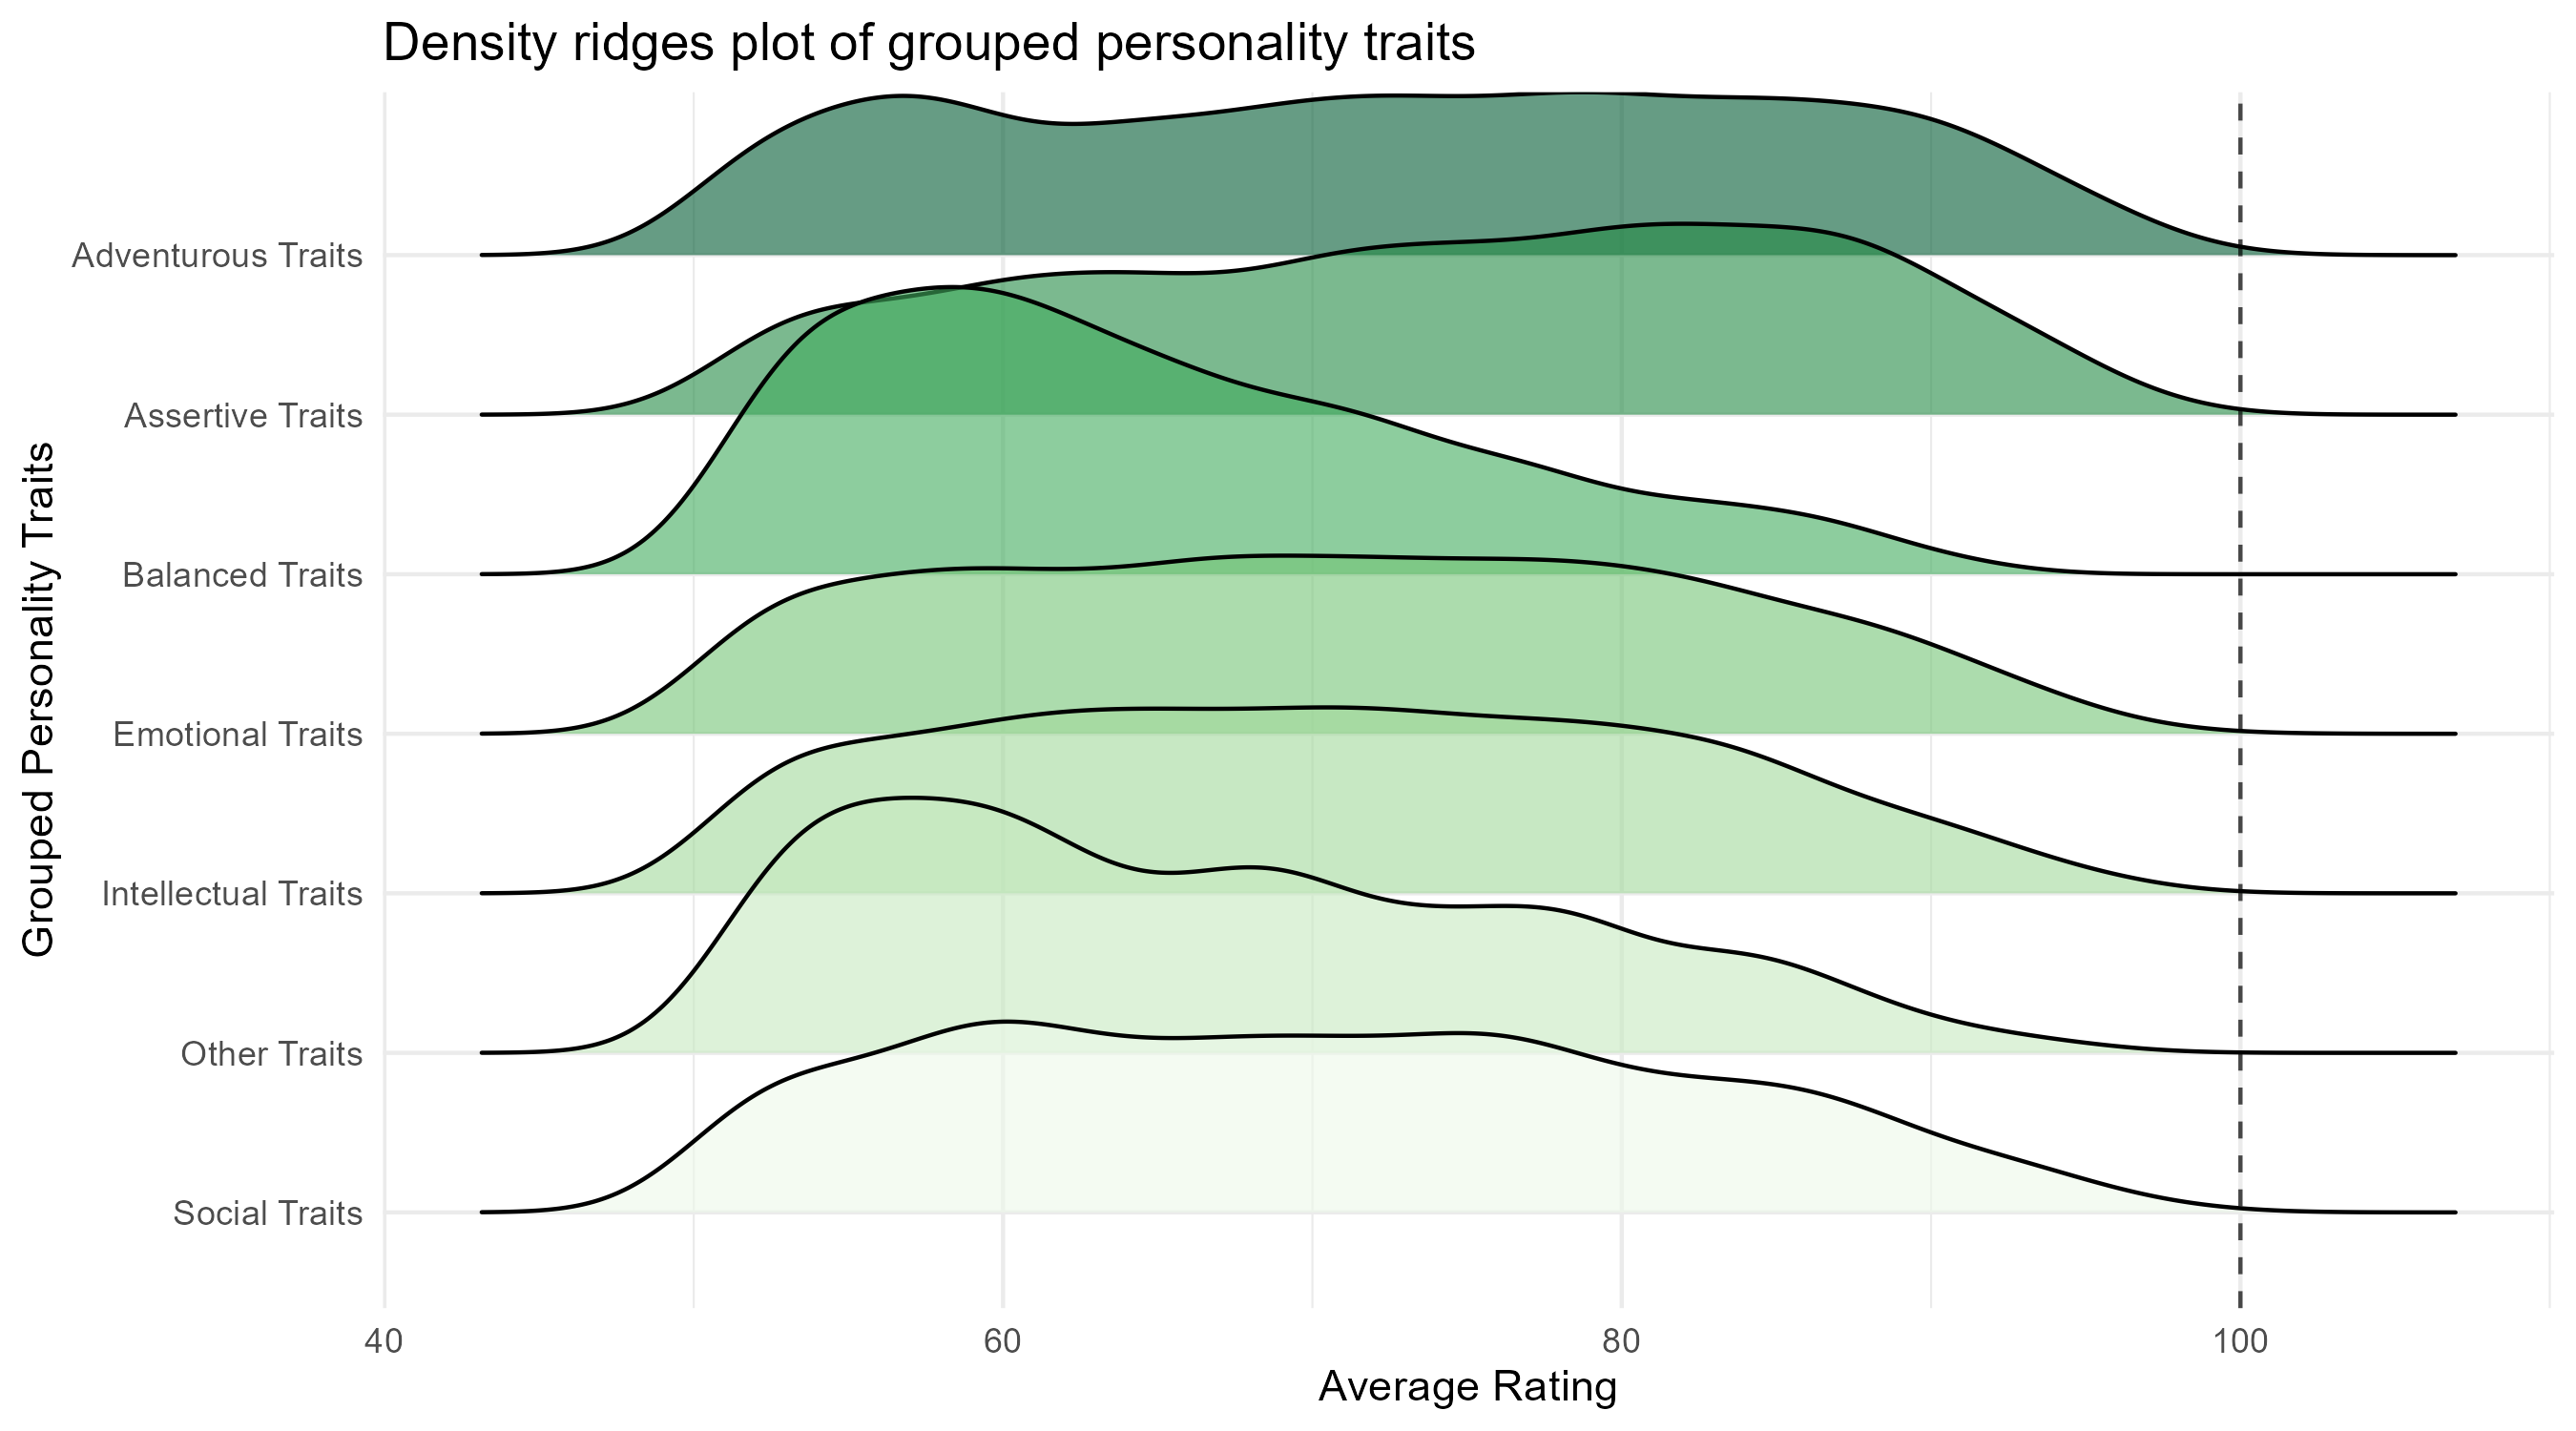
  • Different personality traits have been classified into different groups.
  • The frequency distribution of characters across multiple universes have been plotted along with their average rating from a score out of 100.
  • Regardless of the type of personality traits, the average rating remains similar.
  • After looking into the data, it seems that there is no correlation between frequency distribution and average rating.

Question 2 - Part 1

  • This plot shows the distribution of average rating of different groups of personality.
  • While every group is zero skewed, only ‘balanced’ and ‘other’ traits are right skewed.

Question 2 - Part 2

  • From the plot it is clear that there are very insignificant differences in the average notability score across the personality groups of different characters.

Conclusion

  • Different universes have different Myers-Briggs distributions, which could be influenced by different genres.
  • There was no discernible relationship between average rating and personality groups.
  • There is little variation in character notability scores according to personality traits.