Big Tech Stock Prices
INFO 526 - Spring 2024 - Project 1
Objective
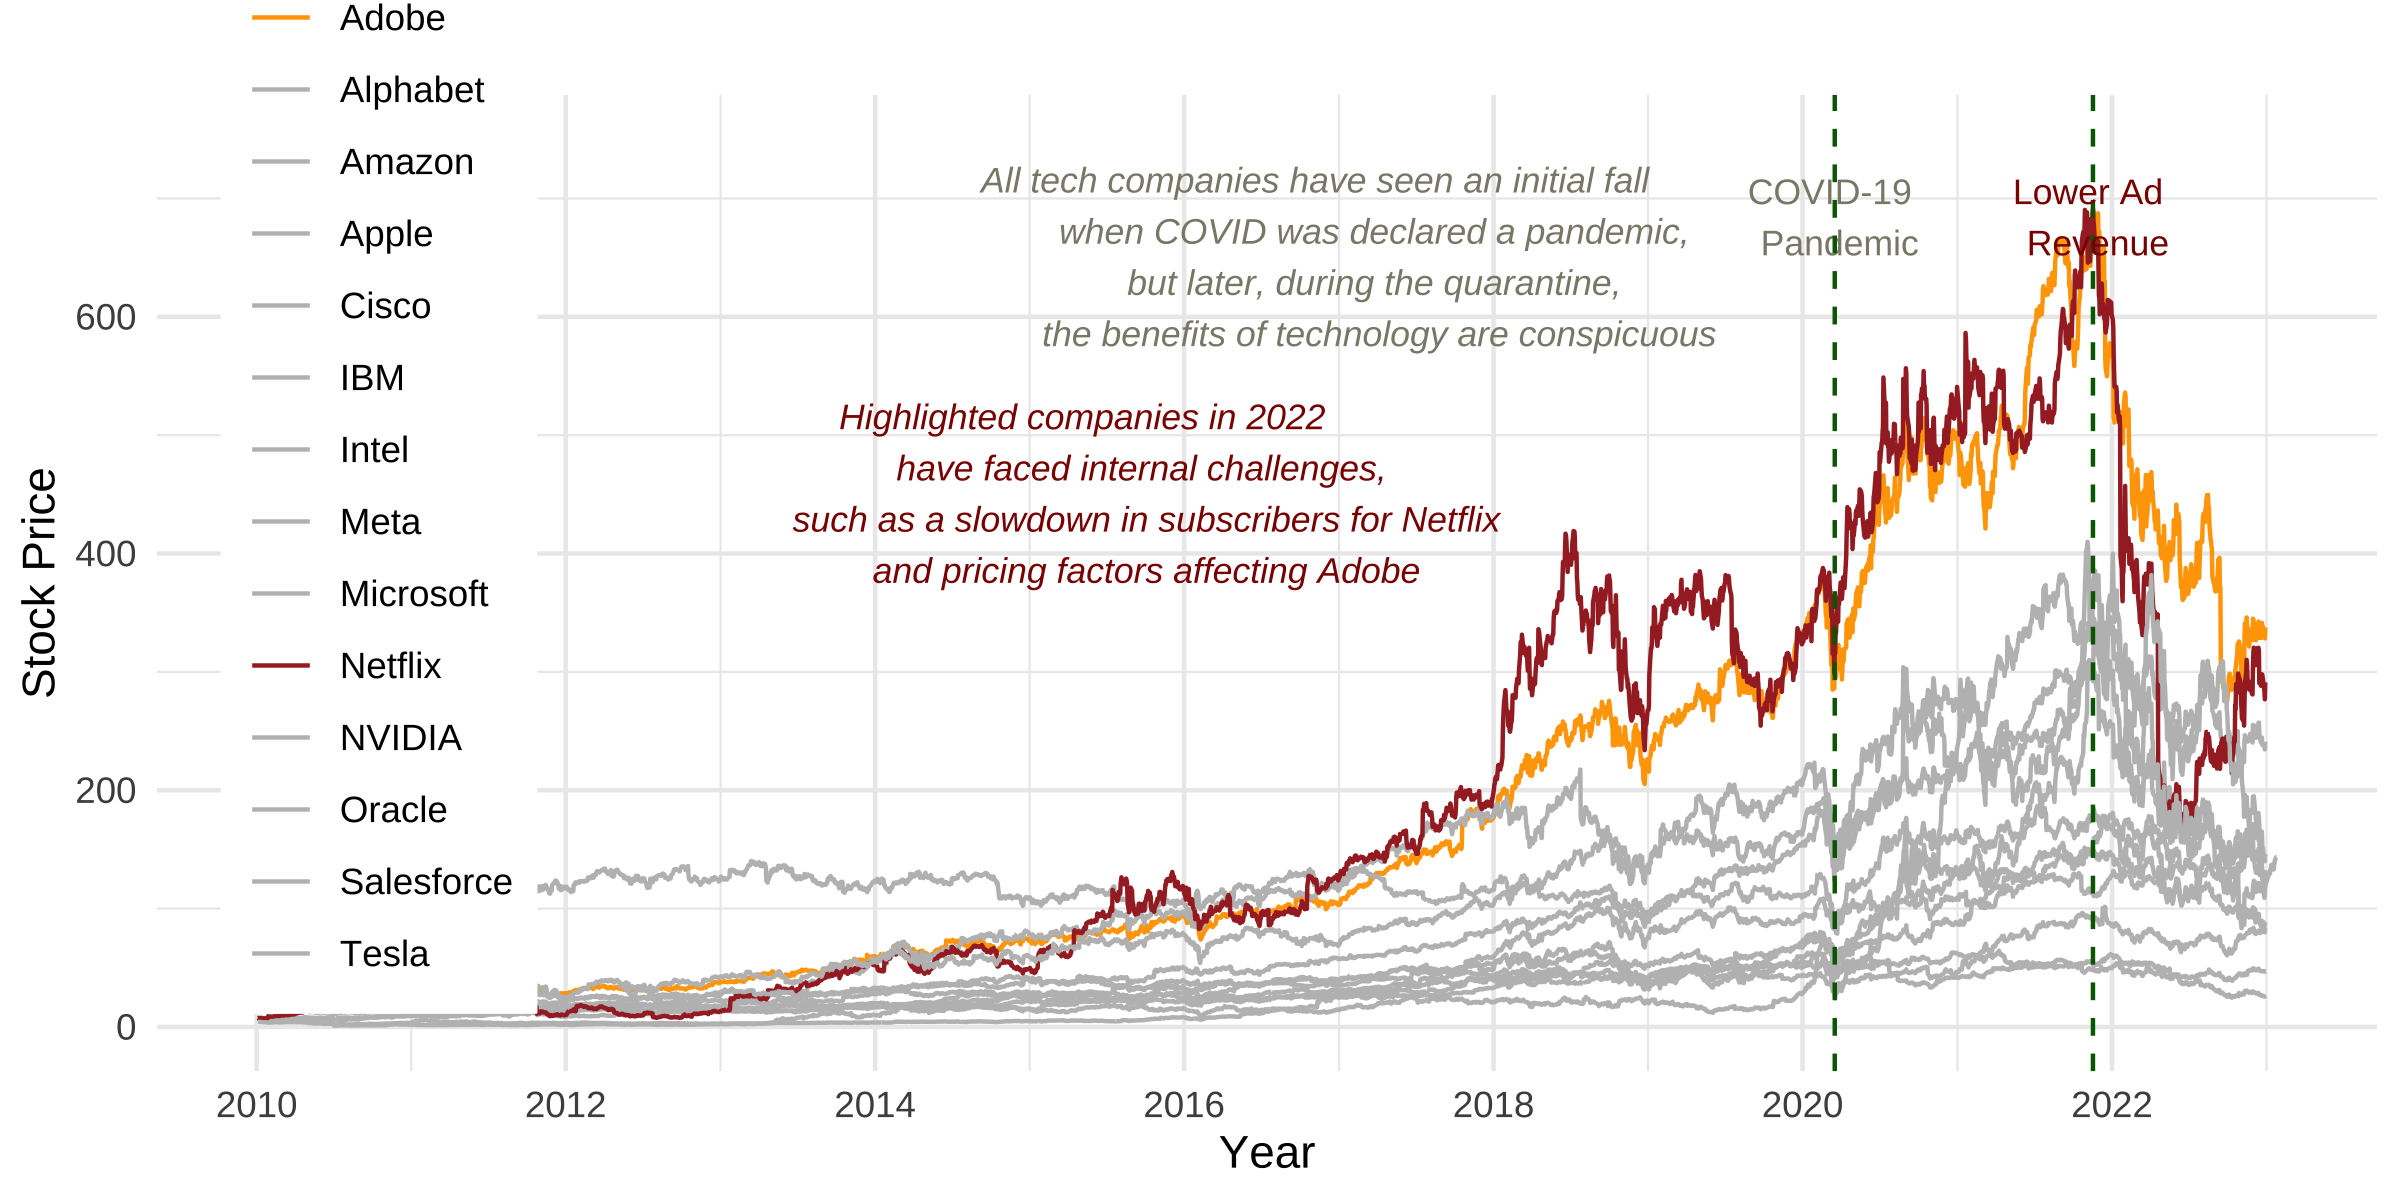
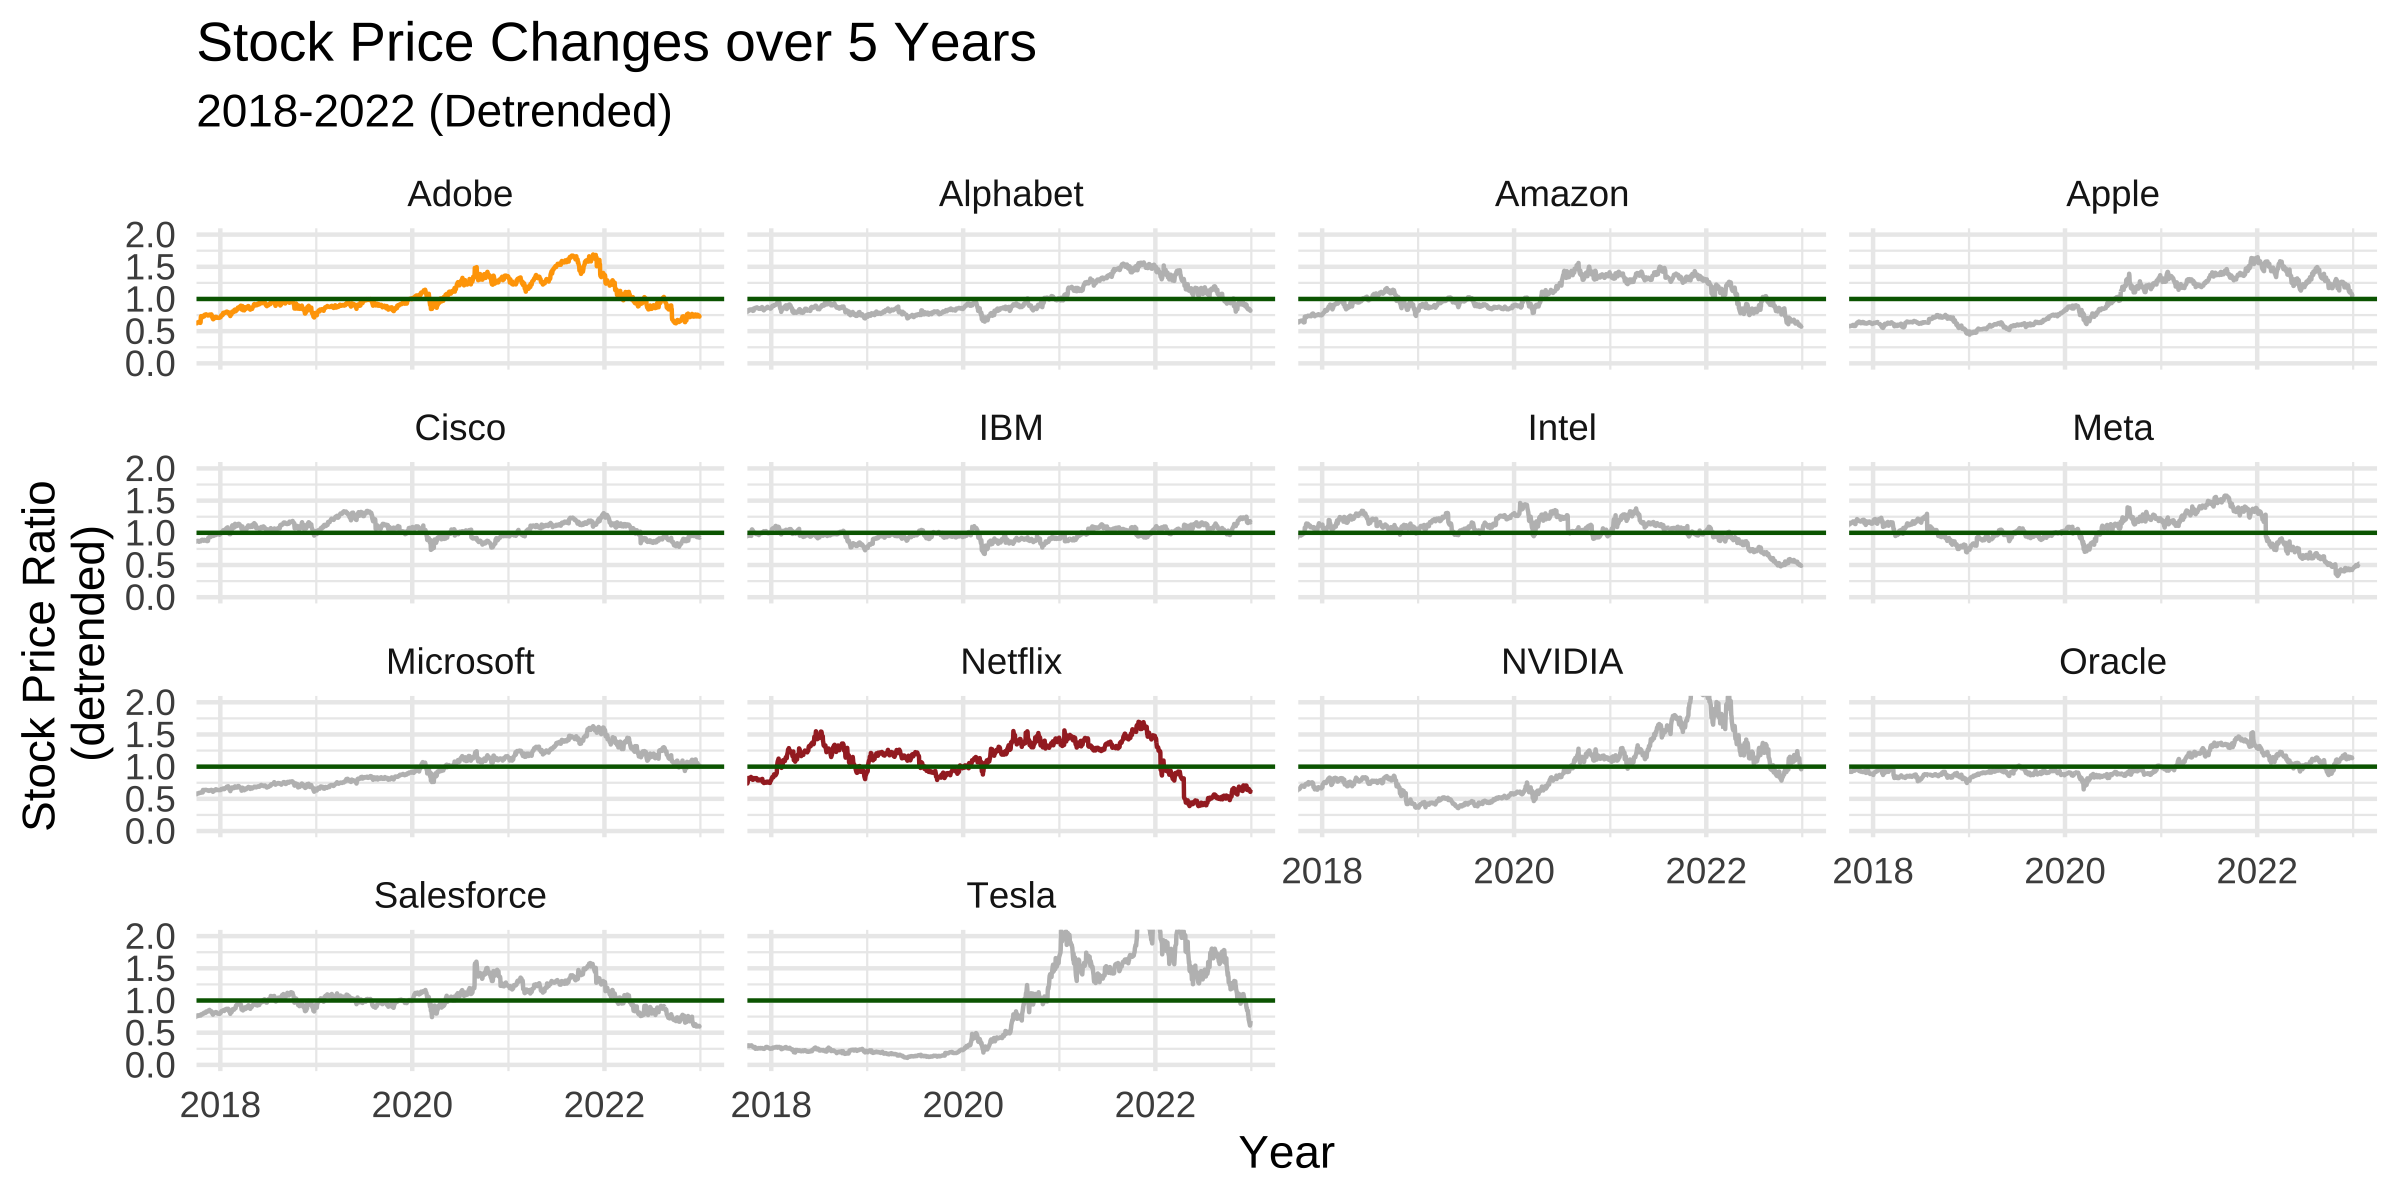
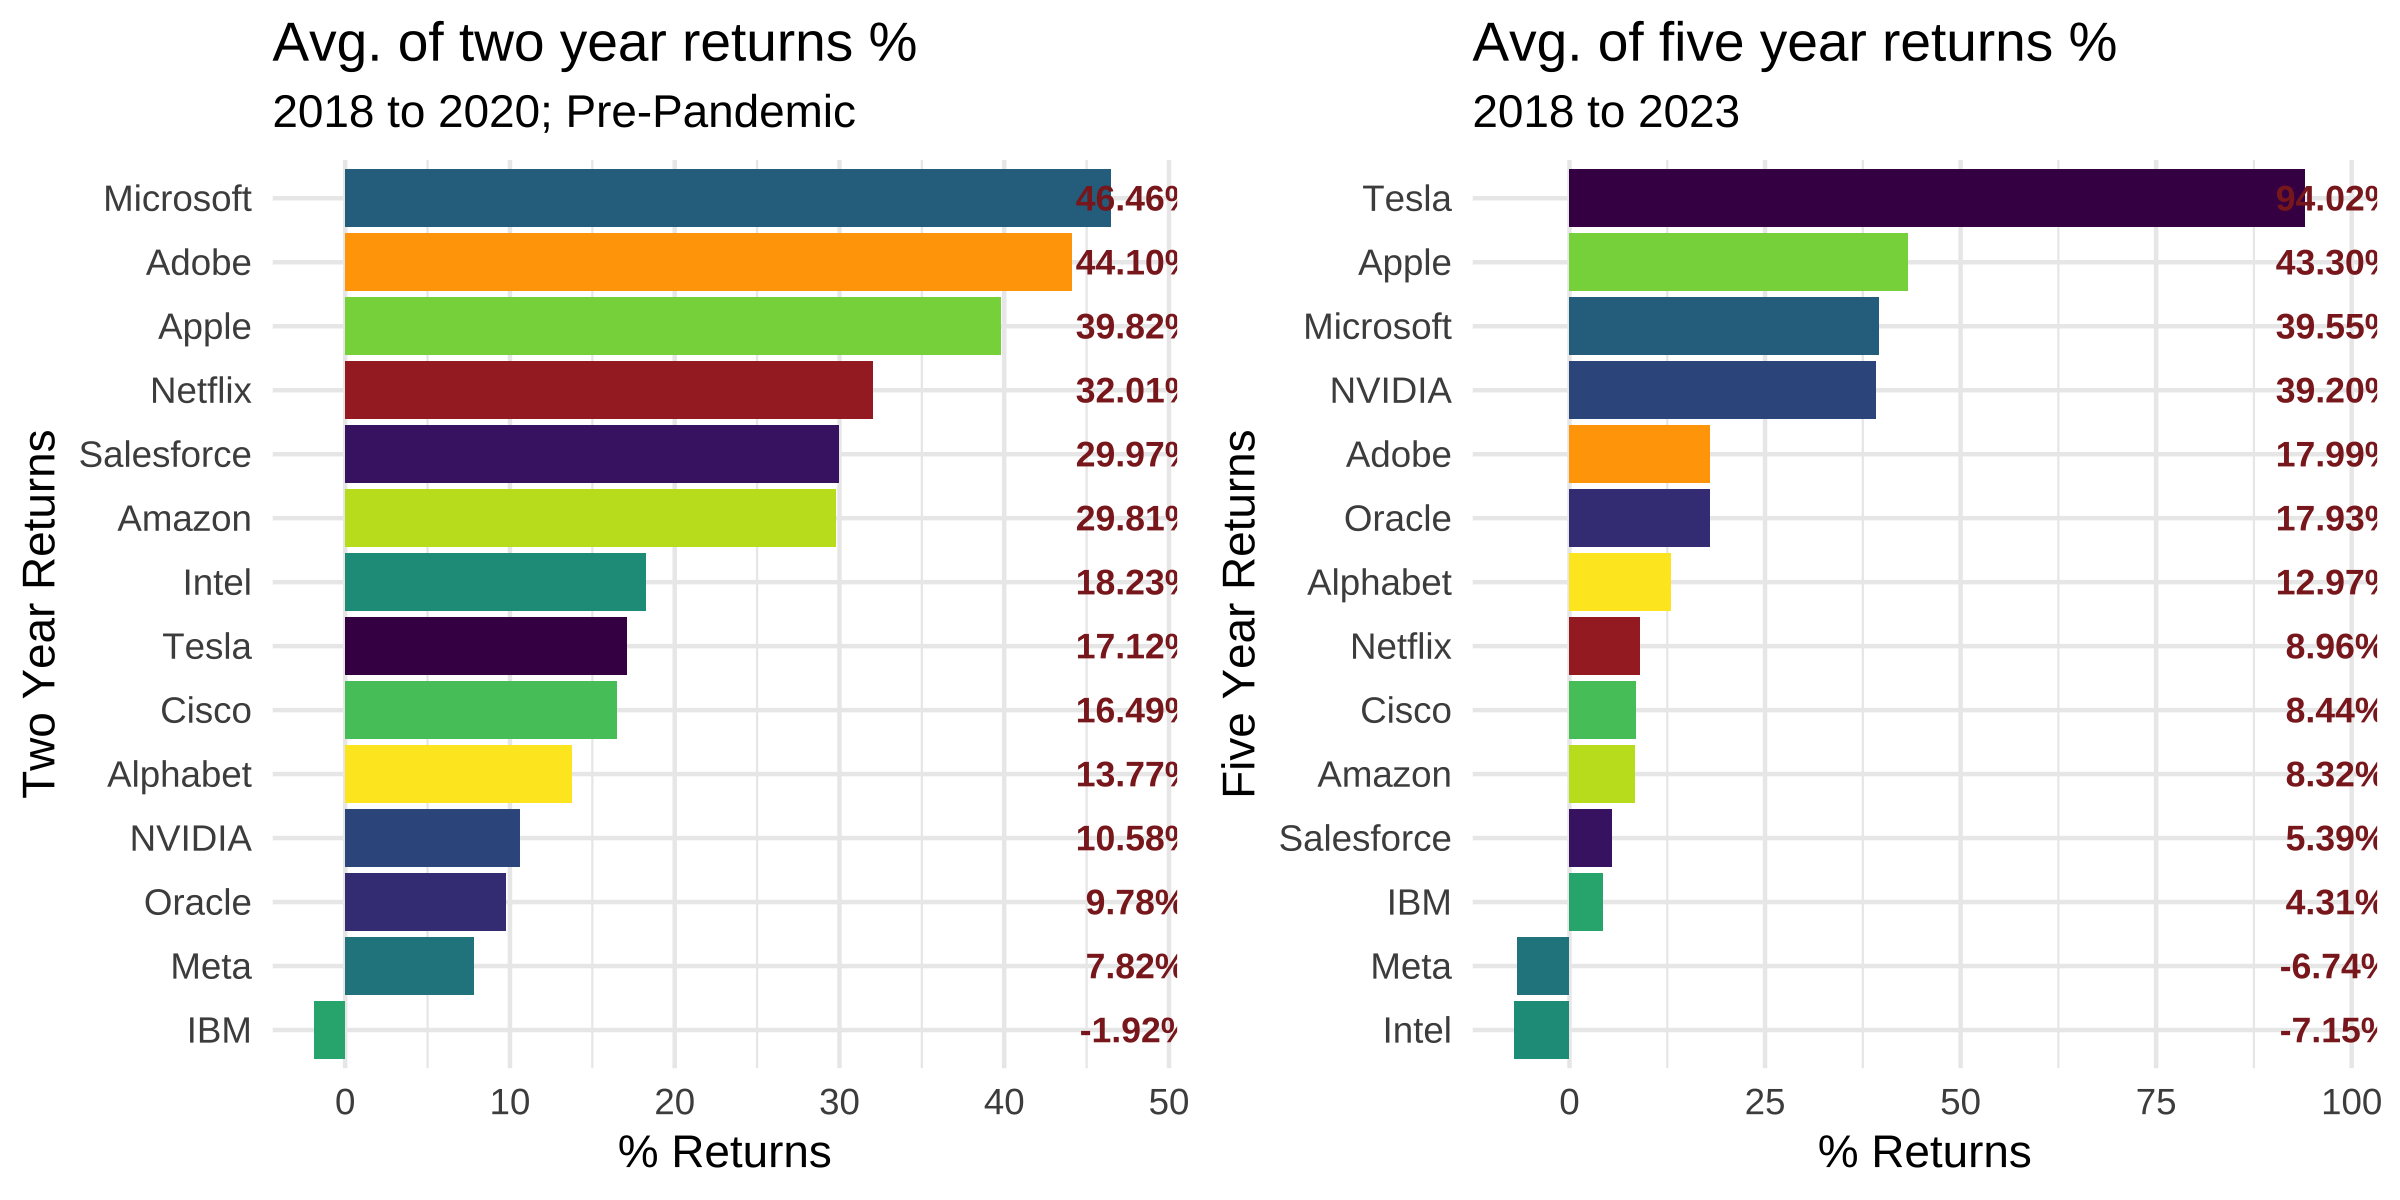
- Delving into the performance of 14 leading tech companies, with a focus on understanding the influence of COVID-19.
- Question 1: Which companies have experienced the highest/lowest impact on their stock prices due to the pandemic?
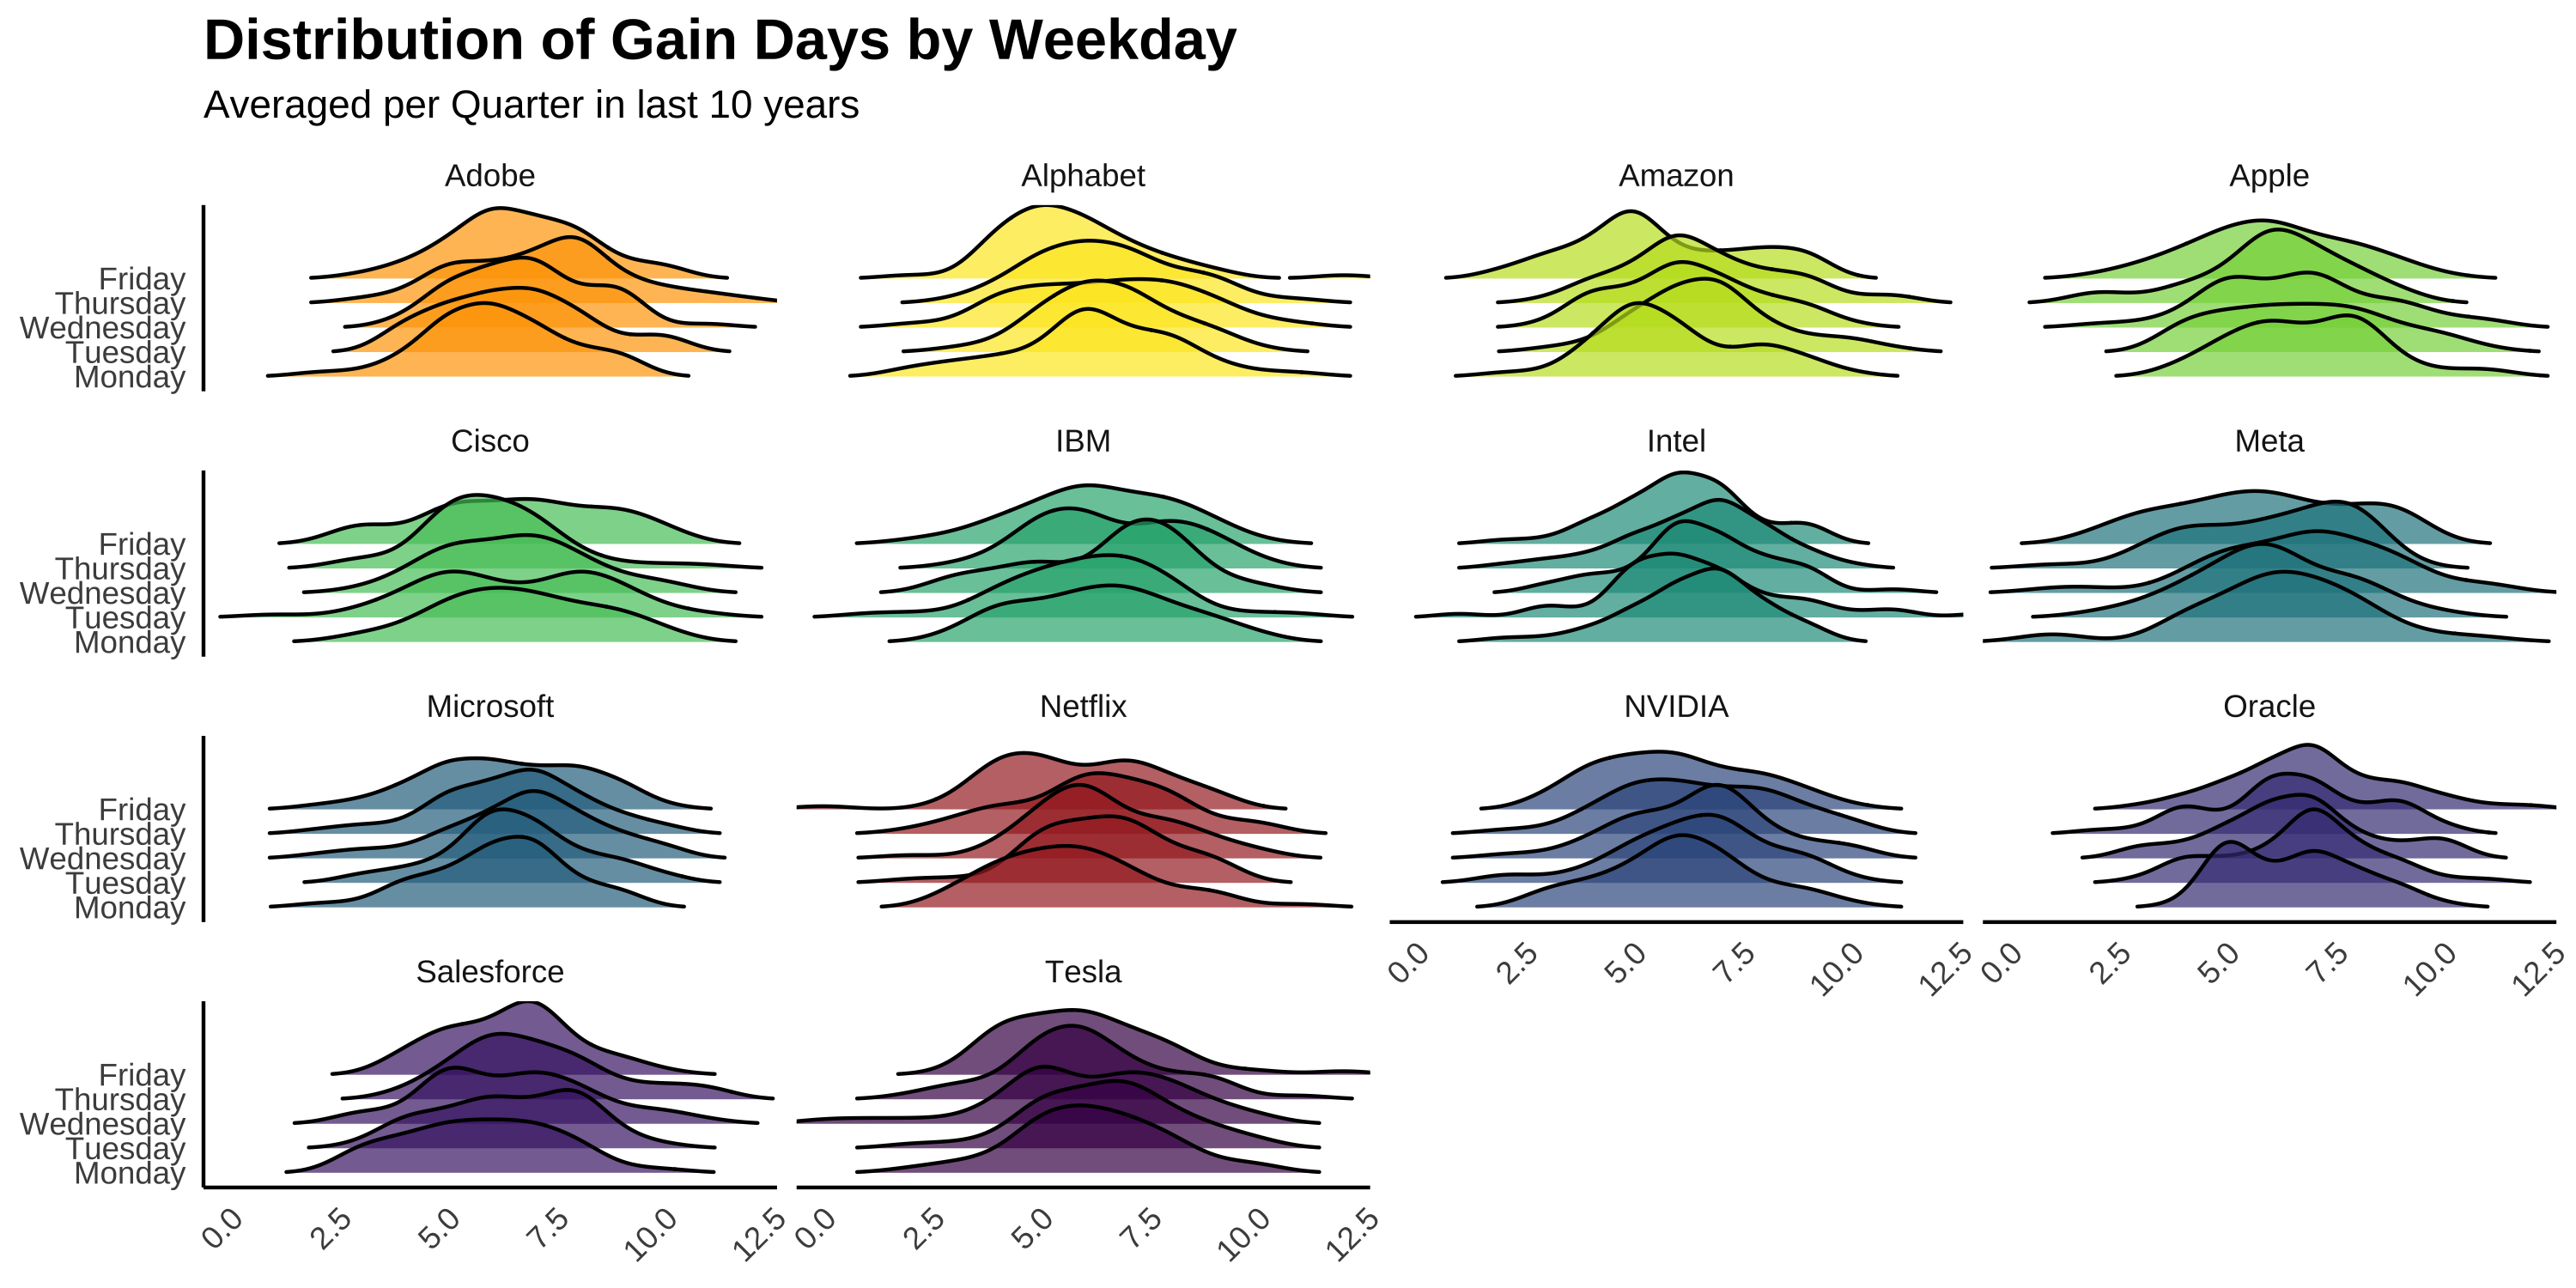
- Question 2: What patterns do we see in the positive gain days over the given period?

Impact of Stock Prices around COVID-19
+Ve Gain Days Trading Strategies
![]()