Examining Global Refugee Trends and Correlations Over the Years
INFO 526 - Fall 2023 - Project 1
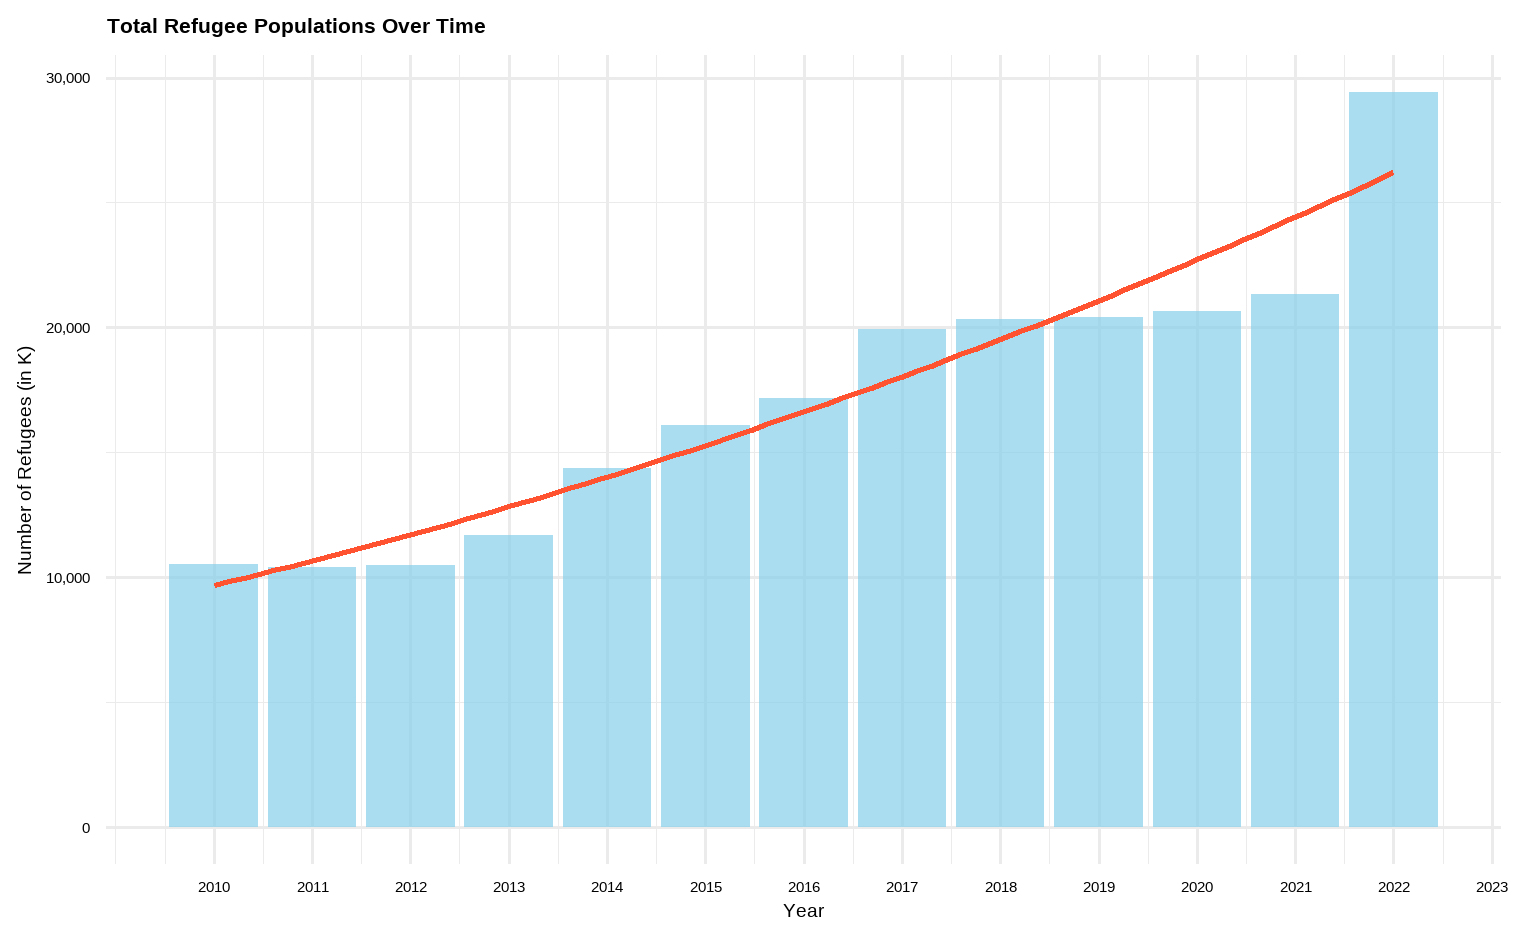
Analysis: Refugee populations over time
- Expeditious growth of the refugee population over time
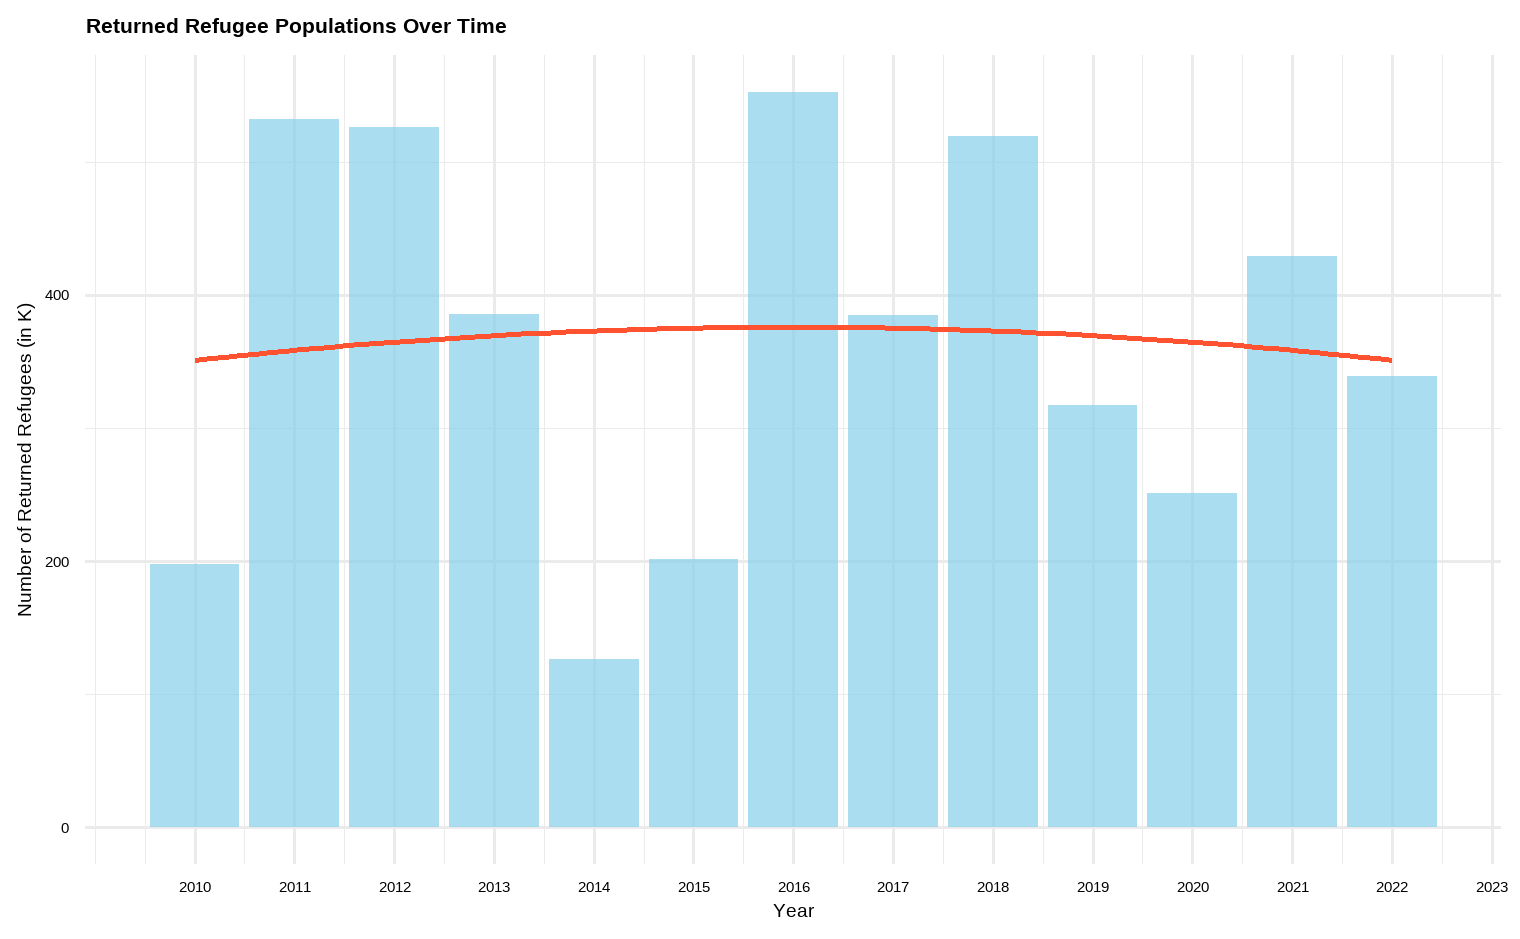
Analysis: Refugee populations over time
- A small number of refugees have returned over a period of time
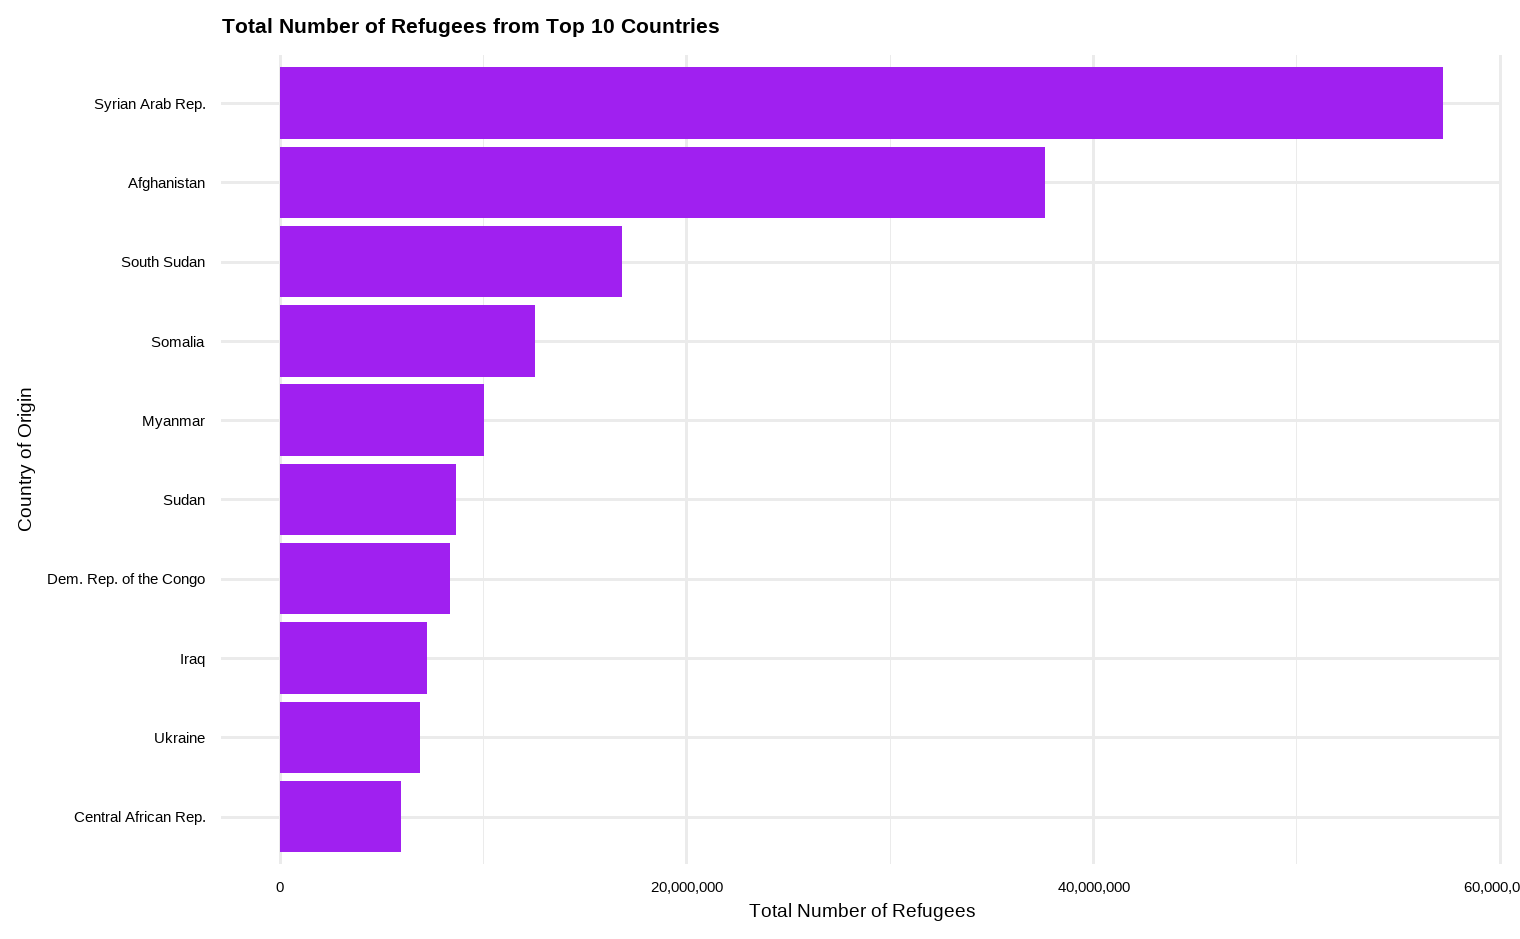
Analysis: Refugees by year and country of origin
- Top 10 countries with the highest total number of refugees
- The maximum number of refugee came has come from Syrian, Afghanistan and South Sudan
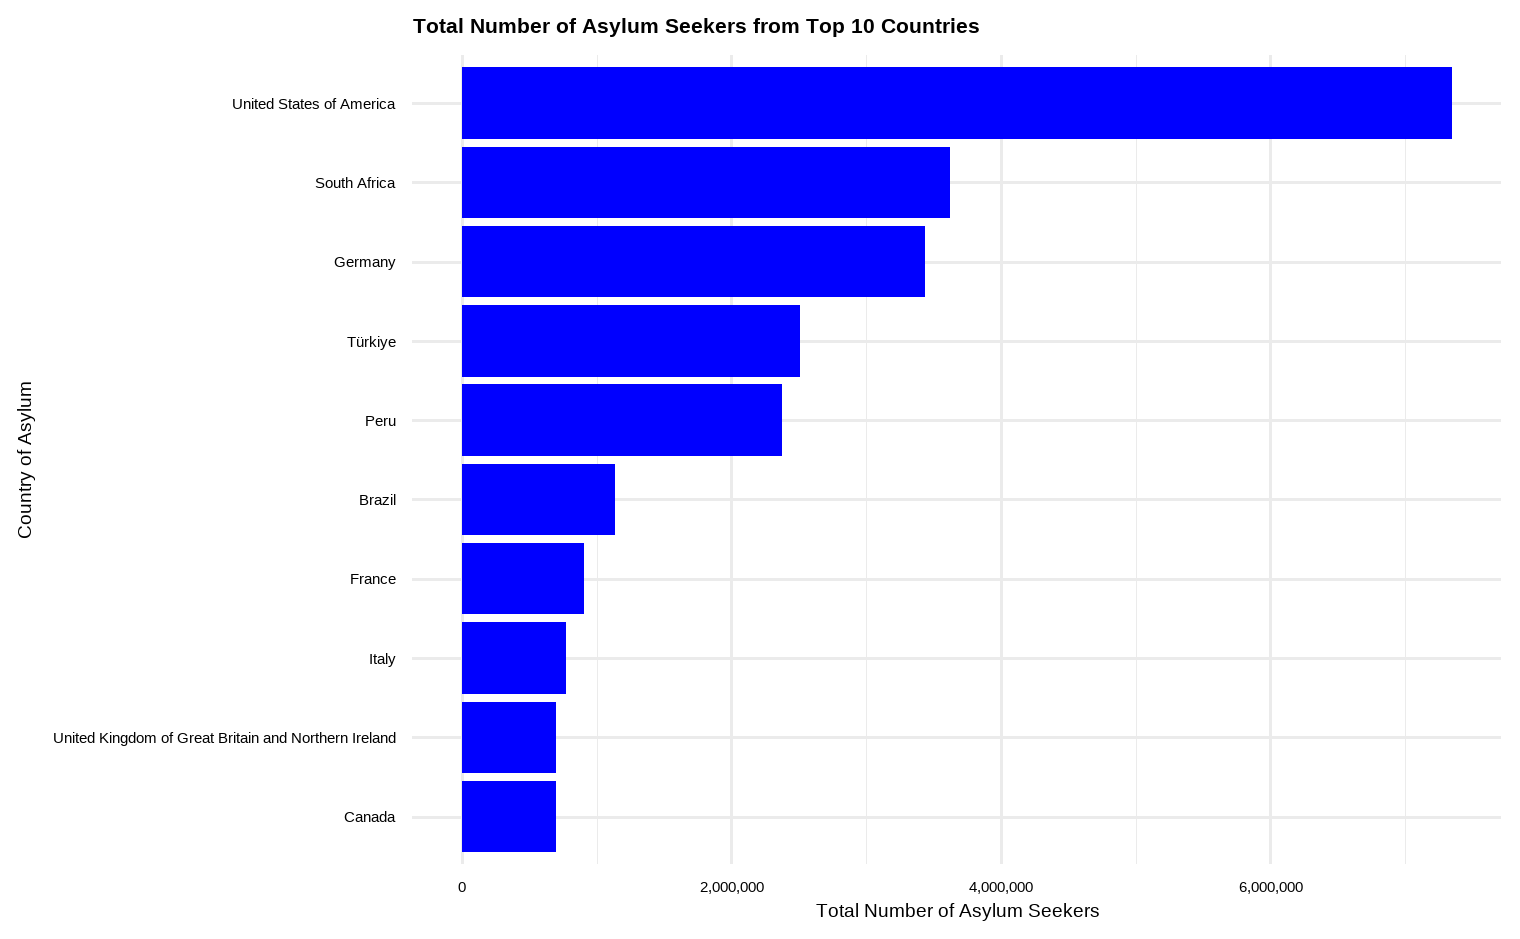
Analysis: Refugees by year and country of origin
- Top 10 countries with the highest total number of asylum seekers
Analysis: Refugee populations over time with US political context.
- A small number of refugees have returned over a period of time
Plot-Alpha
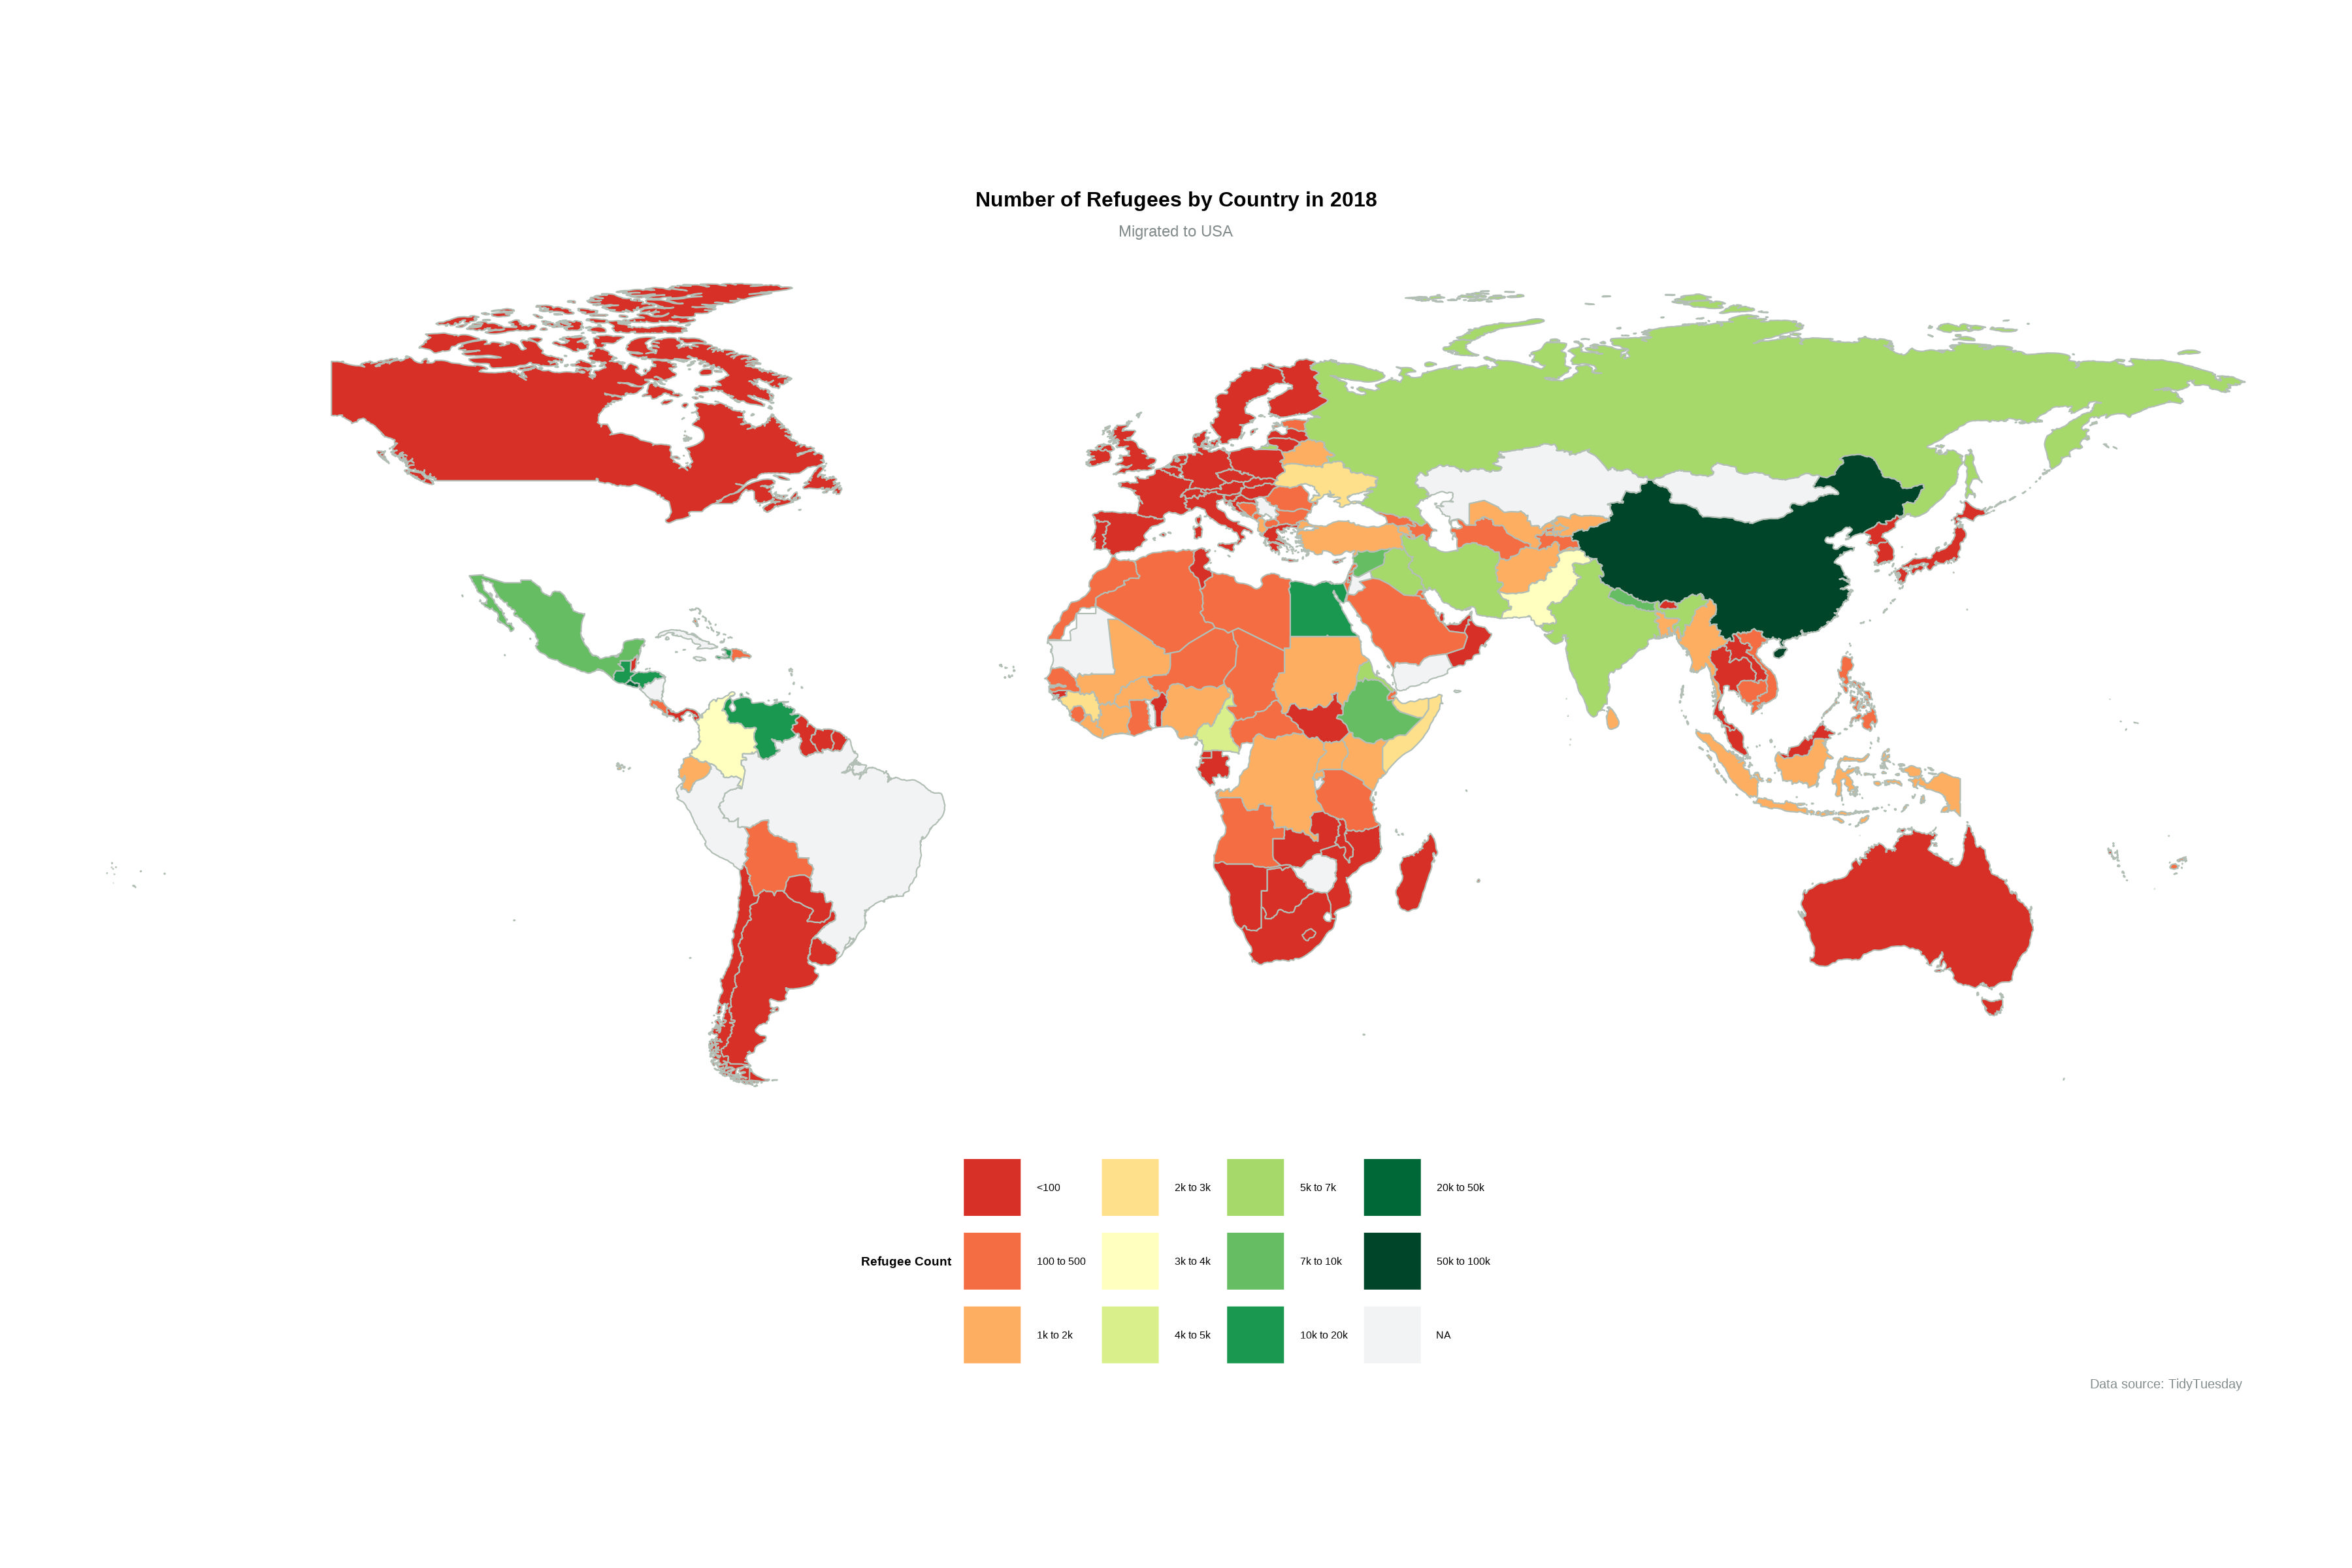
War Effect in Year 2010-2016
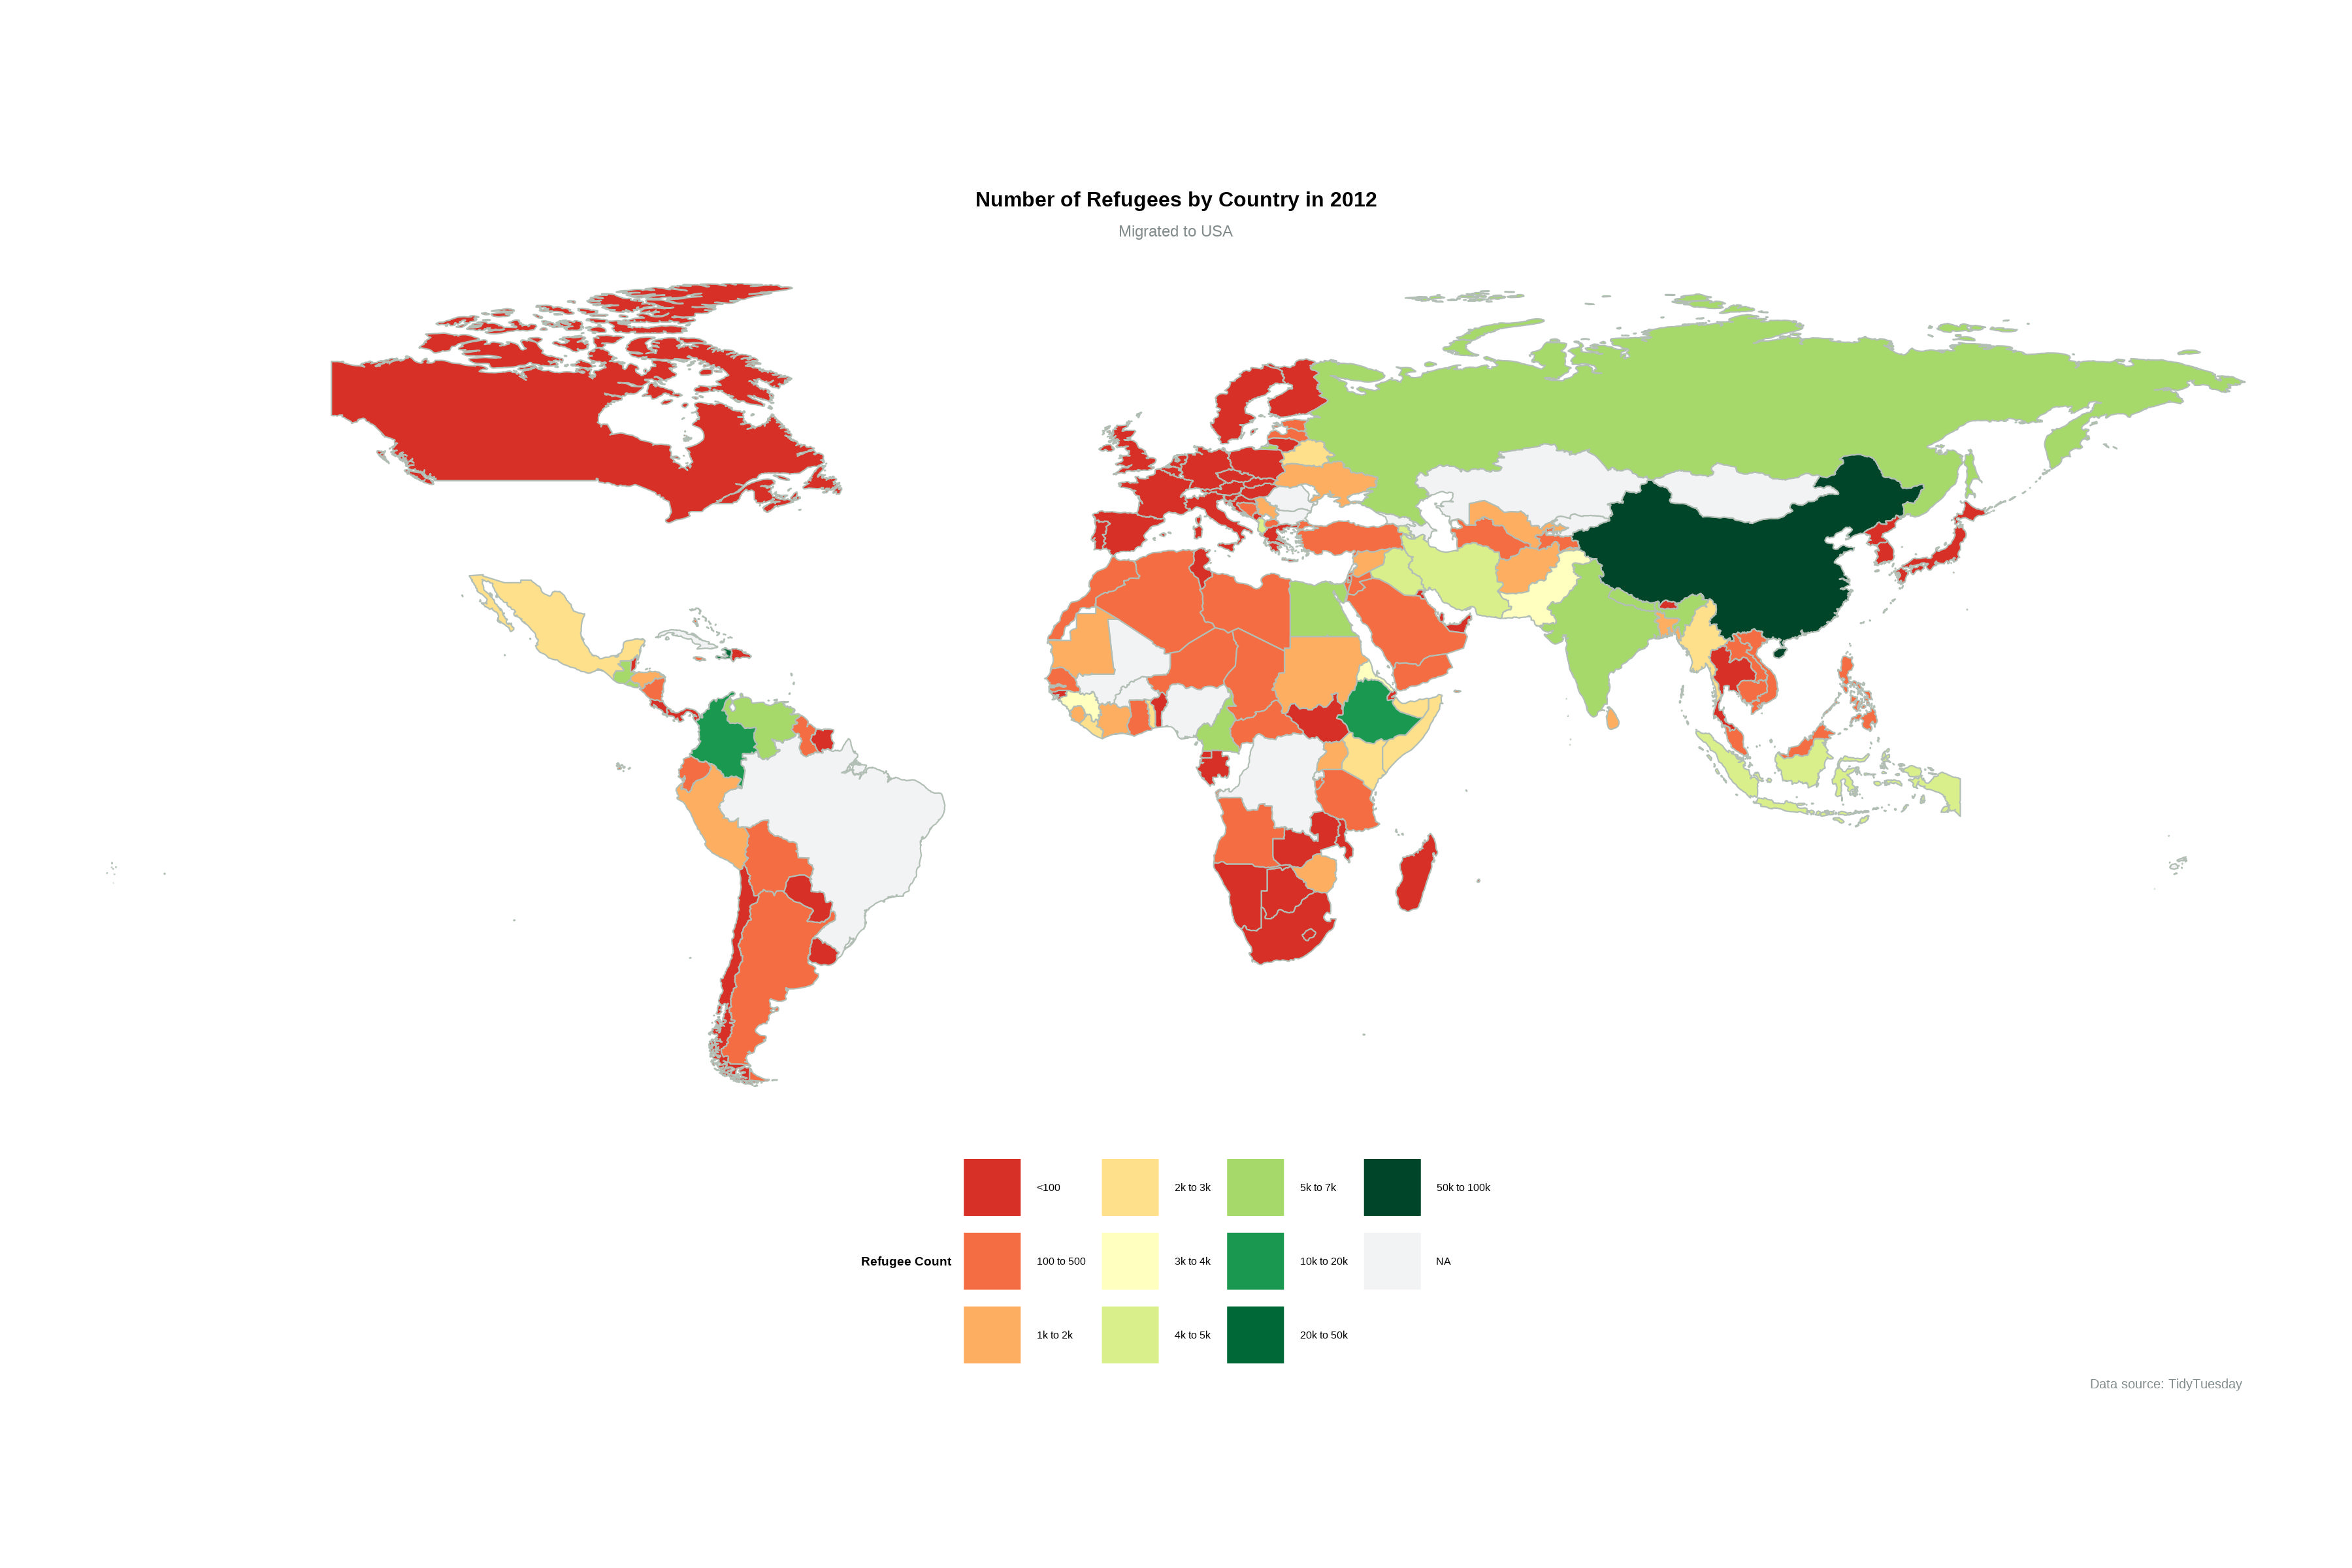
- Early in the decade, migrations might be influenced by the aftermath of the global financial crisis of 2008, conflicts such as the war in Afghanistan or Iraq, or ongoing issues in countries like Somalia and china.
- This period may show increased migrations from the Middle East, particularly Syria, due to the Syrian Civil War beginning in 2011.
- Other regions might also exhibit changes due to local conflicts or economic instability.
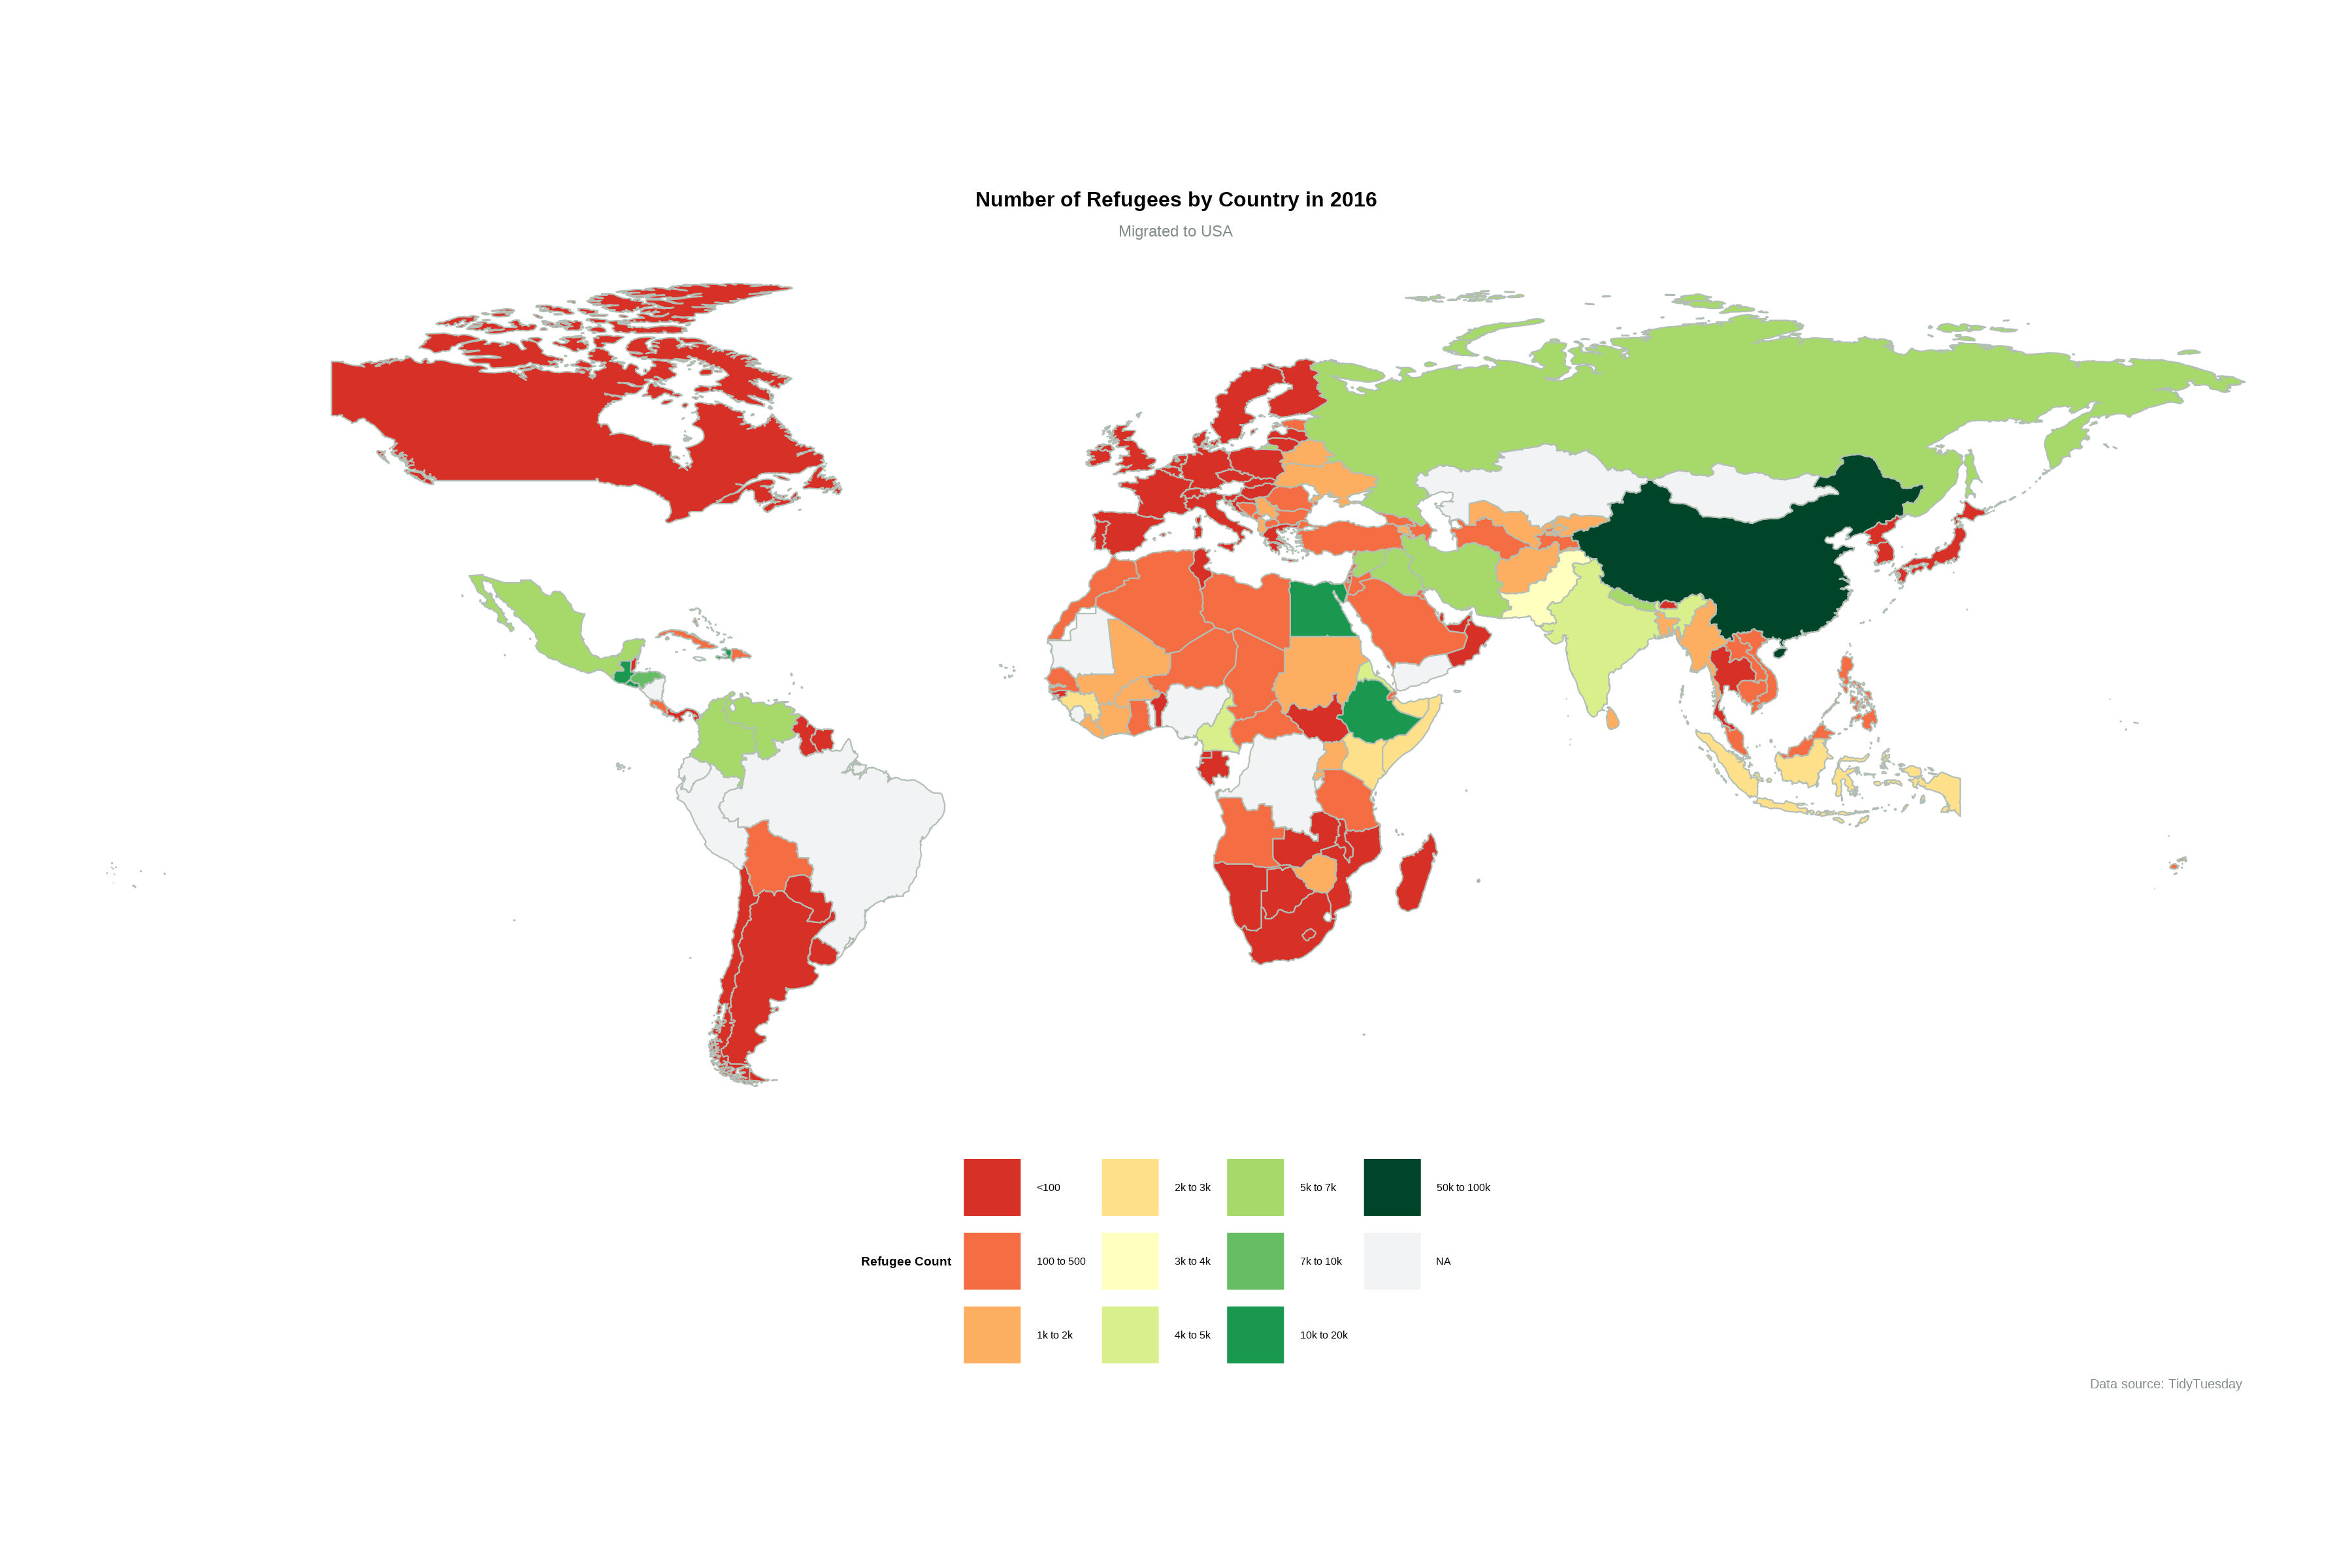
Economic / Climate Conditions in Year 2016-2019
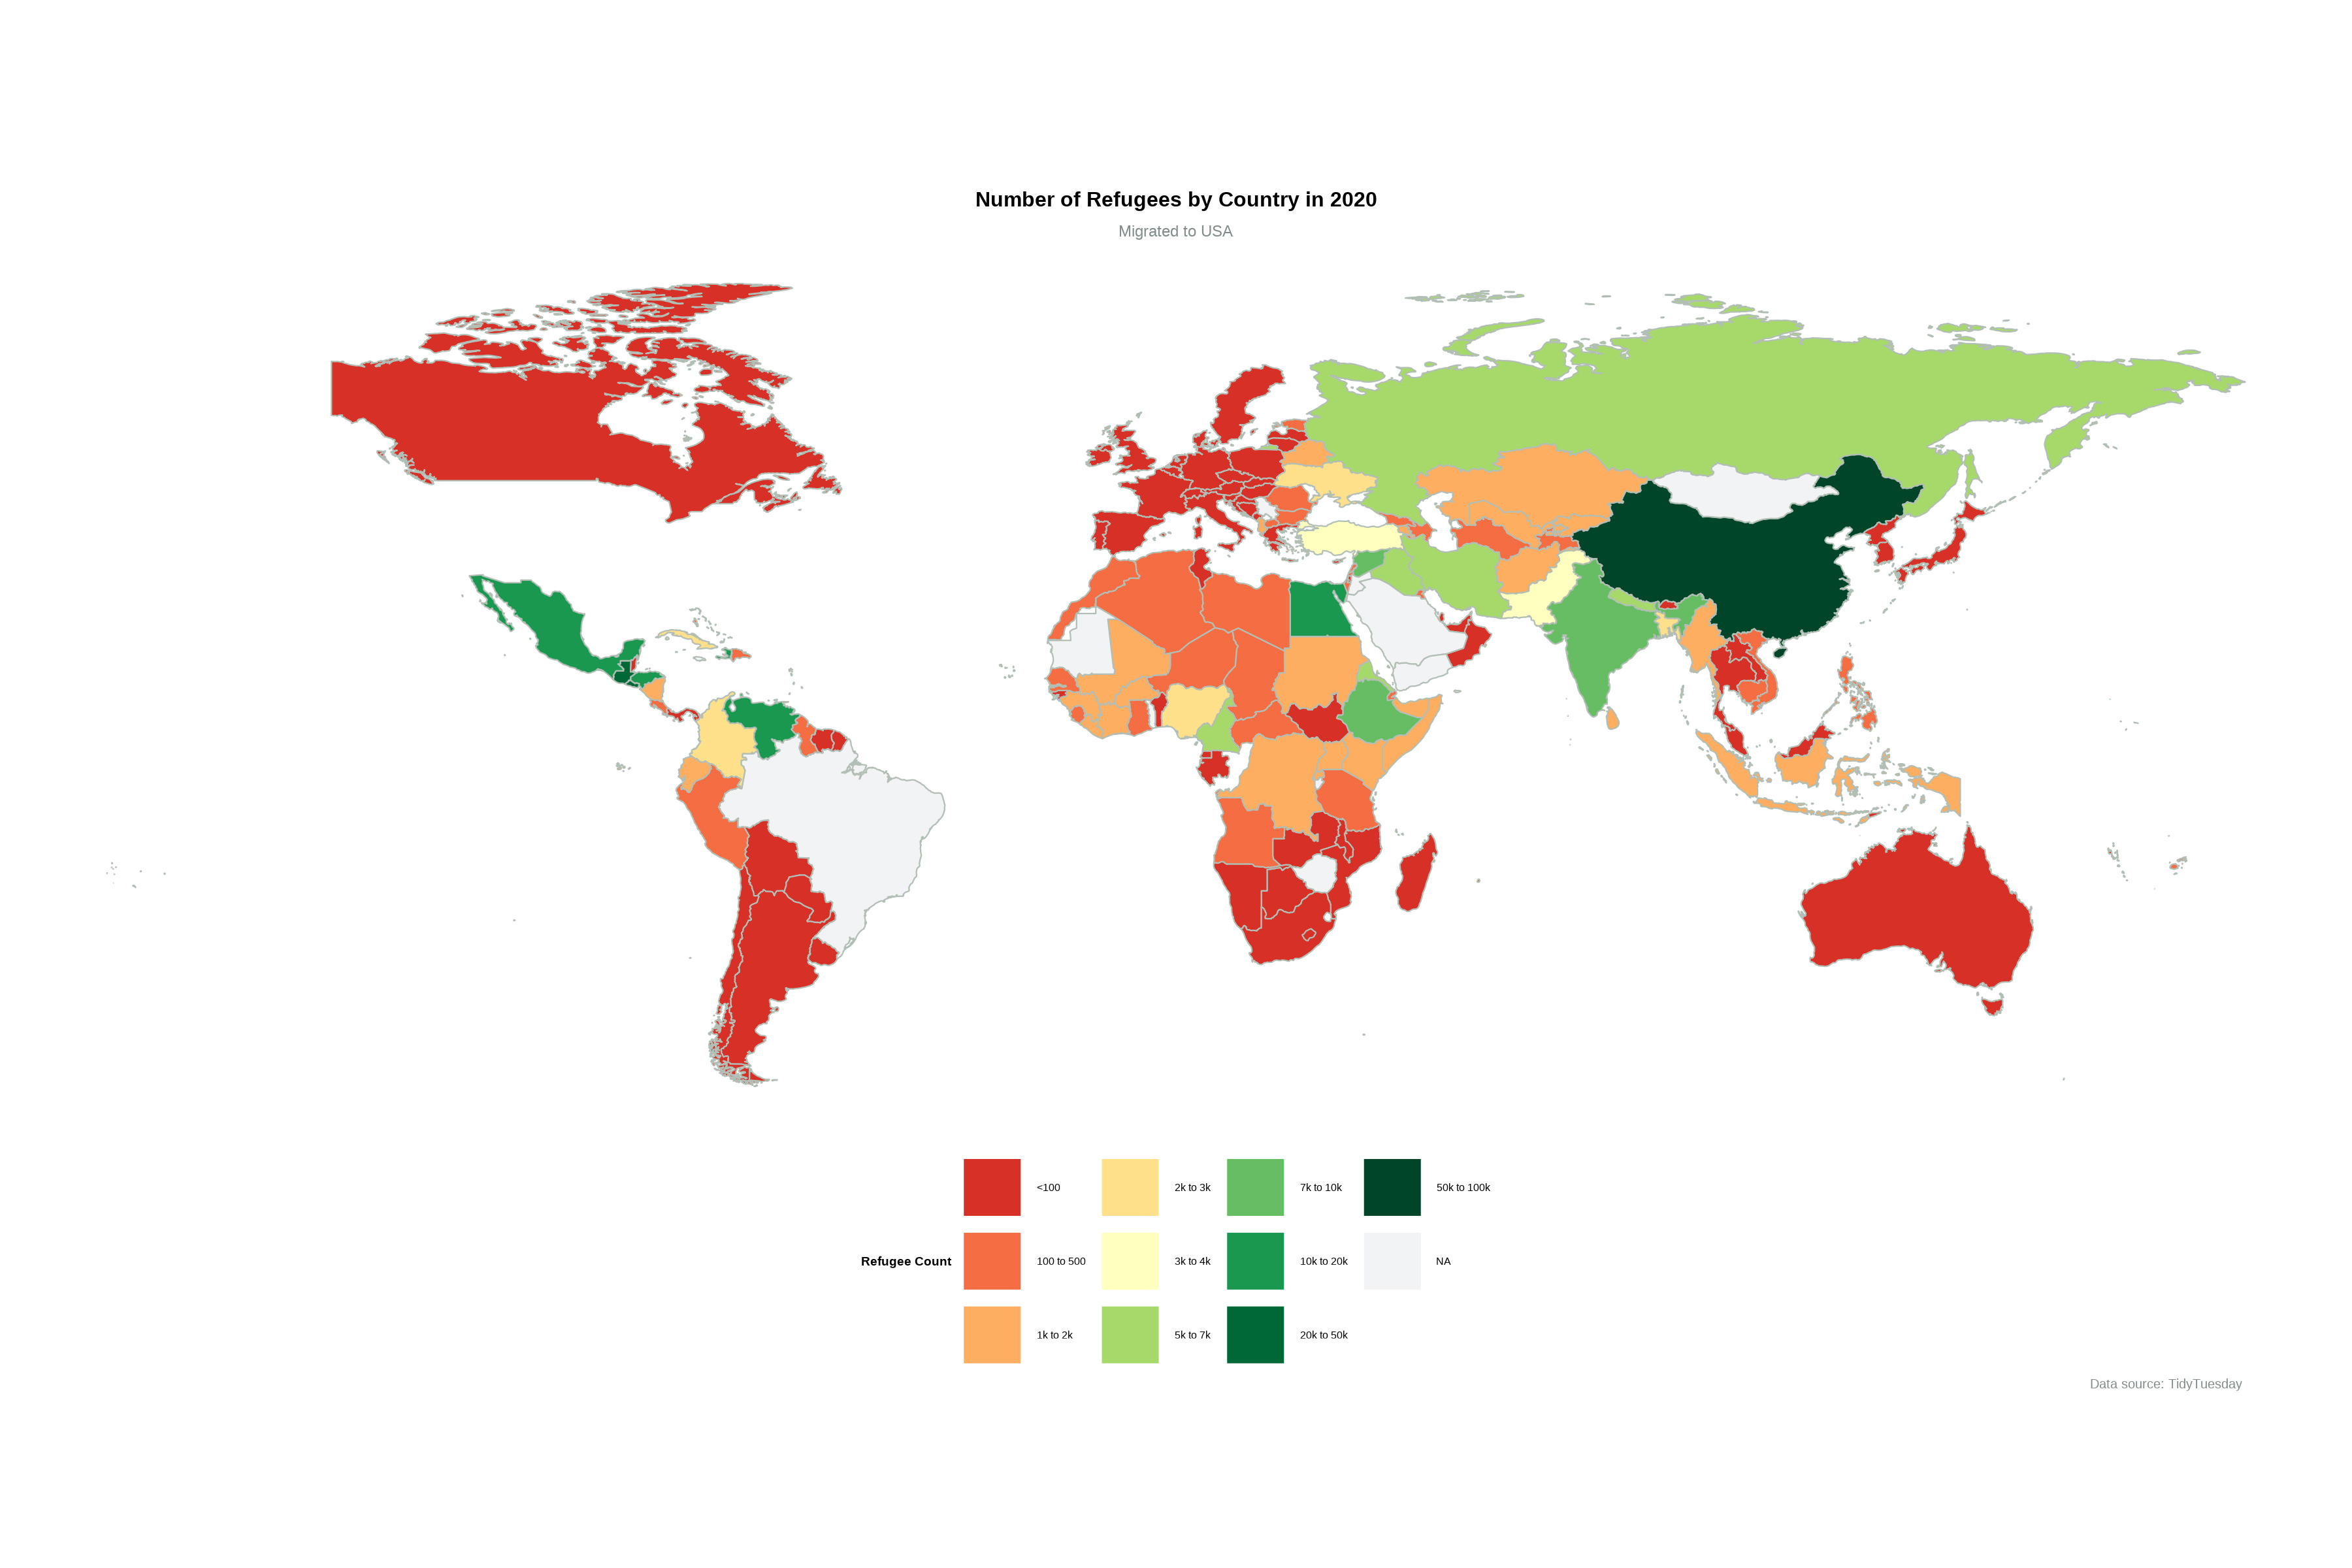
- The refugee crisis in Europe might influence numbers, with potential spillover effects on US Refugee/asylum applications.
- Policy changes in the USA regarding immigration during the new administration might also become visible.
- Continued conflicts and economic issues in various countries could maintain or increased refugee movements.
World Health Crisis and Policy Change in Year 2019-2022
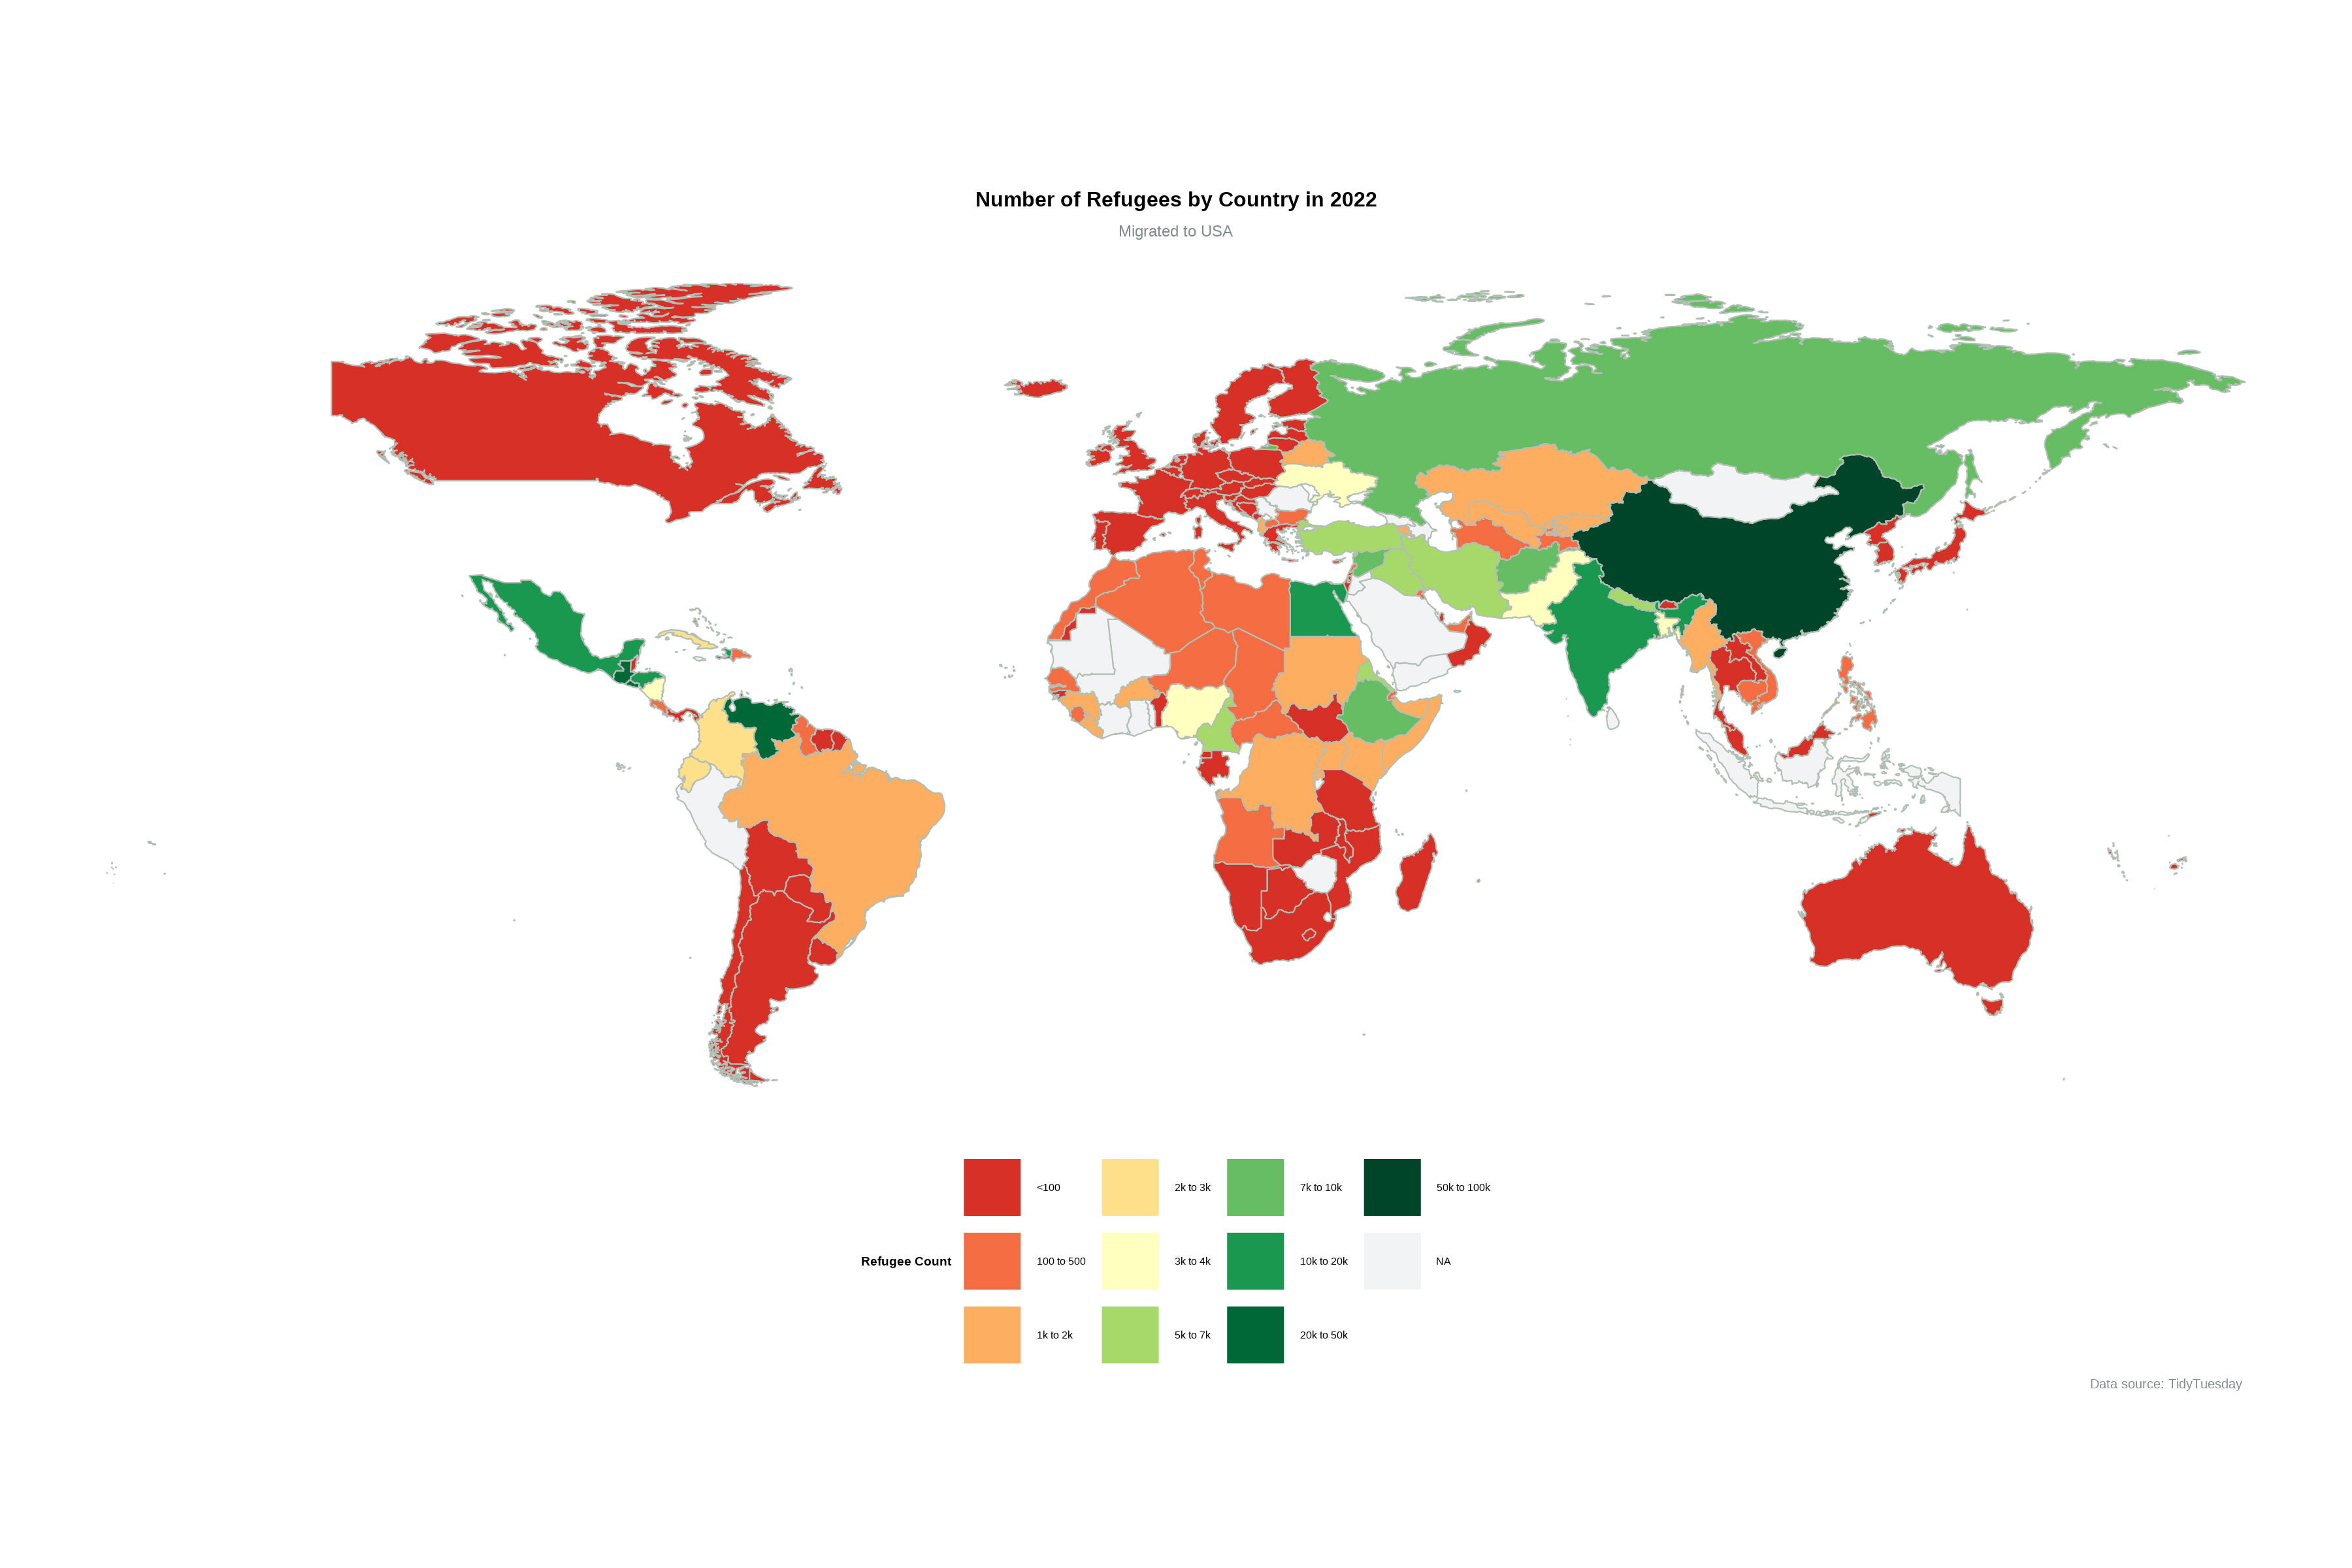
- The COVID-19 pandemic would likely cause a significant drop in migrations worldwide due to travel restrictions and border closures.
- Post-pandemic recovery may lead to an increase in migrations as countries lift travel bans.
- The situation in Afghanistan post-US withdrawal could result in an increase in refugees from that region.
EUREKAAAAAAAAAA!!!!!!!
- While not typically classified as refugees, many Chinese nationals seek to leave China for economic opportunities
- The relationship between China and the USA, including U.S. immigration policy, can influence refugee flows. Policies that allow for a greater number of asylum applications or provide specific provisions for individuals from China can result in higher refugee numbers. Additionally, there may be specific legislative acts or policies targeting the protection of certain groups from China, which could lead to an increase in accepted refugee applications.
Any Question?