Exploring Global Surface Temperature Anomalies
Insights and Visualizations for Climate Understanding
Time Series Analysis - Line Graph

World Map

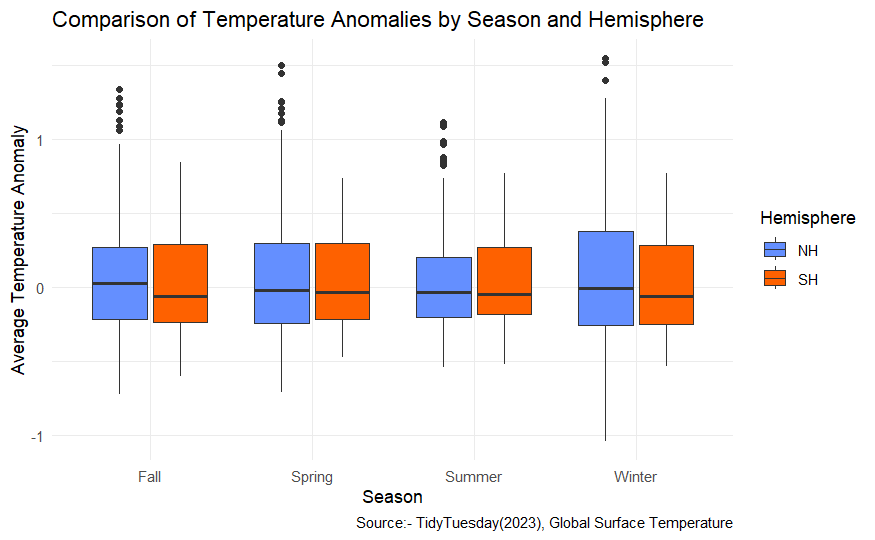
Boxplot
Heatmap

World Map (1880)

World Map (1951)

World Map (2022)

Insights and Visualizations for Climate Understanding