Tucson Car Collision Analysis
INFO 526 - Spring 2024 - Final Project
Data Dazzlers:
Sanja Dmitrovic, Jiayue He, Vidhyananth Sivashanmugam,
Naitik Shah, Varun Soni, Mohammad Ali Farmani
Introduction
The primary goal of the project is to develop a user-friendly, visualization tool that provides detailed insights into the frequency, severity, and causes of traffic accidents in Tucson.
We use the GIS Data from the City of Tucson, which contains publicly-available records of vehicle collisions from the Tucson Police Department covering the period from year 2018 to 2023.
Examples of key variables in this data set are:
Date of collision
Injury severity
Manner of collision
Fatality status
Project Approach
- We will use Quarto dashboard to create dashboard, allowing users to get insights and explore the data based on specific criteria (e.g., time period, accident severity).
- Implement Leaflet for interactive maps to display clustered data and identify accident hot-spots within Tucson using the latitude and longitude coordinates in the data-set.
- Use ggplot2 and Plotly for creating dynamic and static visualizations that can be adjusted according to user.
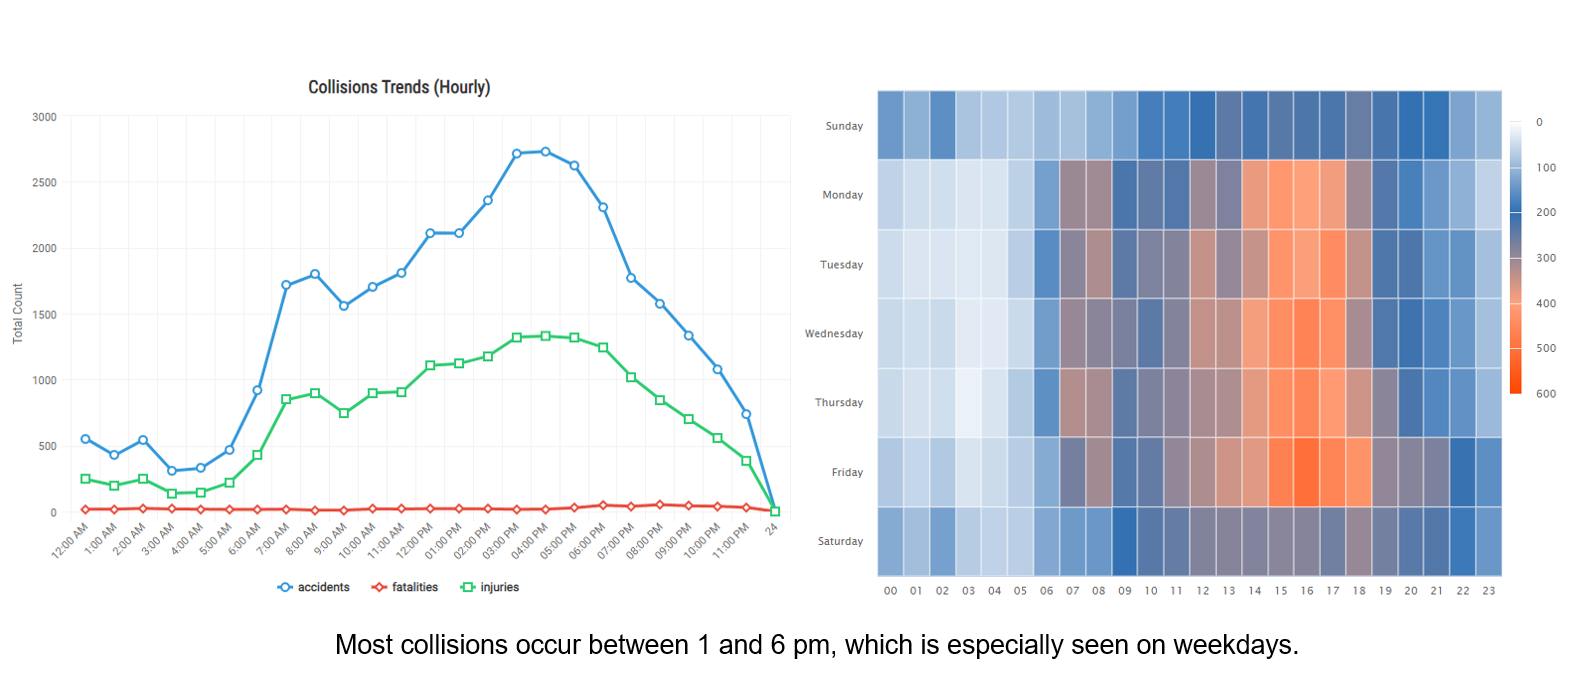
Frequency of Accidents Per Month
Frequency of Accidents Per Day and Hour
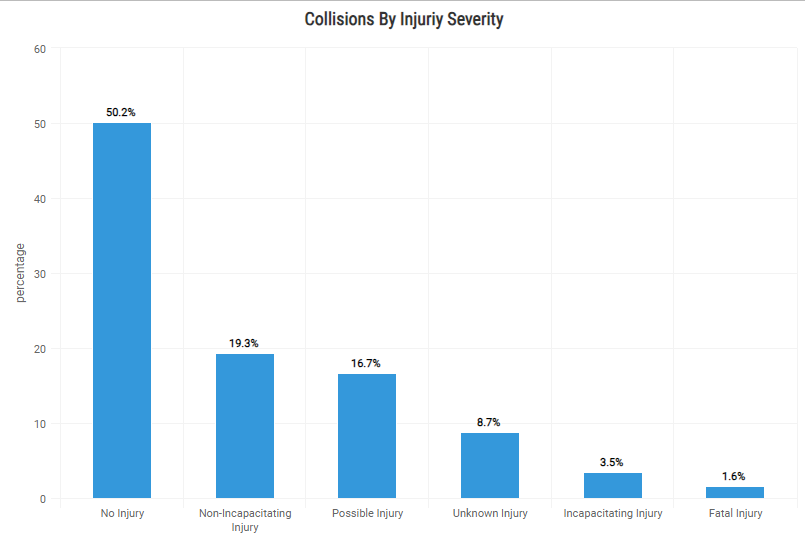
Injury Severity
- It is observed that 50.2% of accidents do not result in injury.
- However, 49.8% of drivers do experience injury from car accidents in Tucson. The most common injury types are non-incapacitating injury and possible injury.
- It is also seen that 1.6% of accidents with fatal injury.
![]()
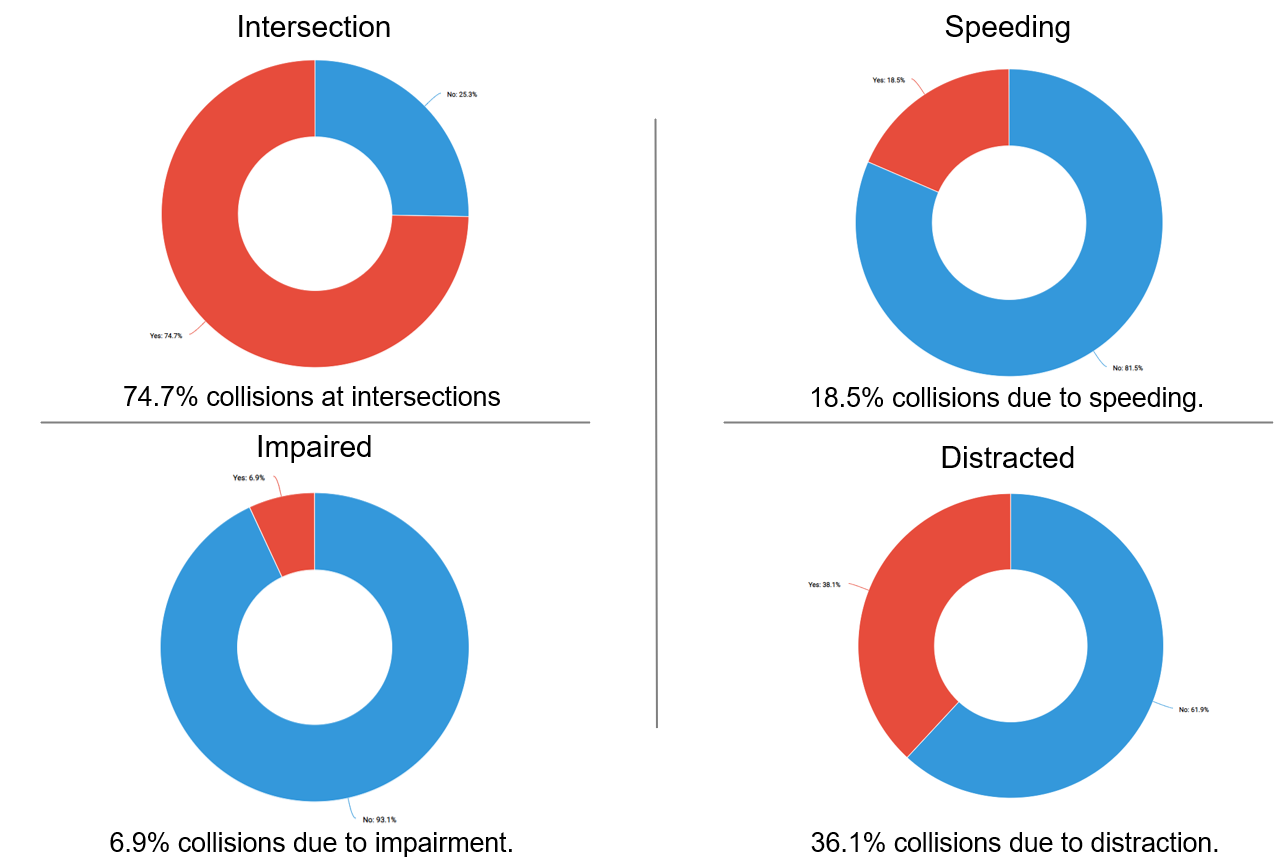
Collision reason
The most common location of collisions is at intersections (74.7%).
38.1% of collisions involve a distracted driver, 18.5% involve a speeding driver, and 6.9% involve an impaired driver.
![]()
Challenges
Interventions or policies implemented based on the analysis may have unintended consequences or lead to unforeseen challenges. Anticipating and mitigating these risks requires careful planning, stakeholder engagement, and flexibility to adapt to changing circumstances.
Real-life applications may face challenges related to the availability and quality of data. Not all cities may have publicly available datasets on traffic accidents, and even if they do, the data may be incomplete, inconsistent, or outdated. This can limit the usefulness of the analysis and its applicability to other locations.
Limitations
The scale and resolution of the visualizations may not always be optimal for conveying meaningful insights. For example, maps with too much detail may overwhelm the viewer, while maps with insufficient detail may fail to capture important geographic features or variations.
Similarly, when visualizing temporal trends in accidents (e.g., by day of week or time of day), the choice of temporal aggregation (e.g., hourly, daily, monthly) can influence the perceived patterns and trends.
Aggregating data over longer time periods may smooth out fluctuations but could also mask important variations at finer temporal resolutions.
Conclusion
Identification of High-Risk Areas: The dashboard effectively pinpoints traffic violation hotspots, aiding in route planning and increasing awareness of dangerous zones.
Enhanced Safety Measures: It empowers users, especially universities, to take specific actions like improving pedestrian safety through better lighting, signage, and enforcement around high-risk areas.
Informed Decision-Making: By visualizing traffic data, the dashboard supports data-driven decisions that can lead to a significant reduction in traffic-related incidents.
Overall Impact: This tool is a valuable asset for promoting safer driving behaviors and enhancing road safety for drivers and pedestrians alike.
Thank You
![]()