Tracing the COVID-19 Trajectory Using Shiny

INFO 526 - Spring 2024 - Project Final

Introduction

  • Comprehensive analysis of COVID-19 data from Kaggle, focusing on case counts, recovery rates, mortality, and vaccination data.

  • Utilizing Shiny app package for interactive and user-friendly data visualization.

  • Providing actionable insights for policymakers and the public.

  • Clear communication of complex data to aid in understanding and response to the global health crisis.

Dataset

  • Kaggle datasets curated by “imdevskp” offer global, country-wise, and detailed COVID-19 statistics, covering day-wise global data, country-wise snapshots, and granular USA county-level breakdowns.

  • These datasets contain critical metrics like case counts, deaths, recoveries, and vaccinations, facilitating in-depth analysis of pandemic trends and impacts.

  • Researchers can utilize these datasets to gain insights into the progression and effects of the COVID-19 pandemic globally and within specific countries and regions.

Question -1

  • How has the COVID-19 pandemic trended globally over time, and what correlations can be observed between different pandemic metrics (like cases and recoveries)?

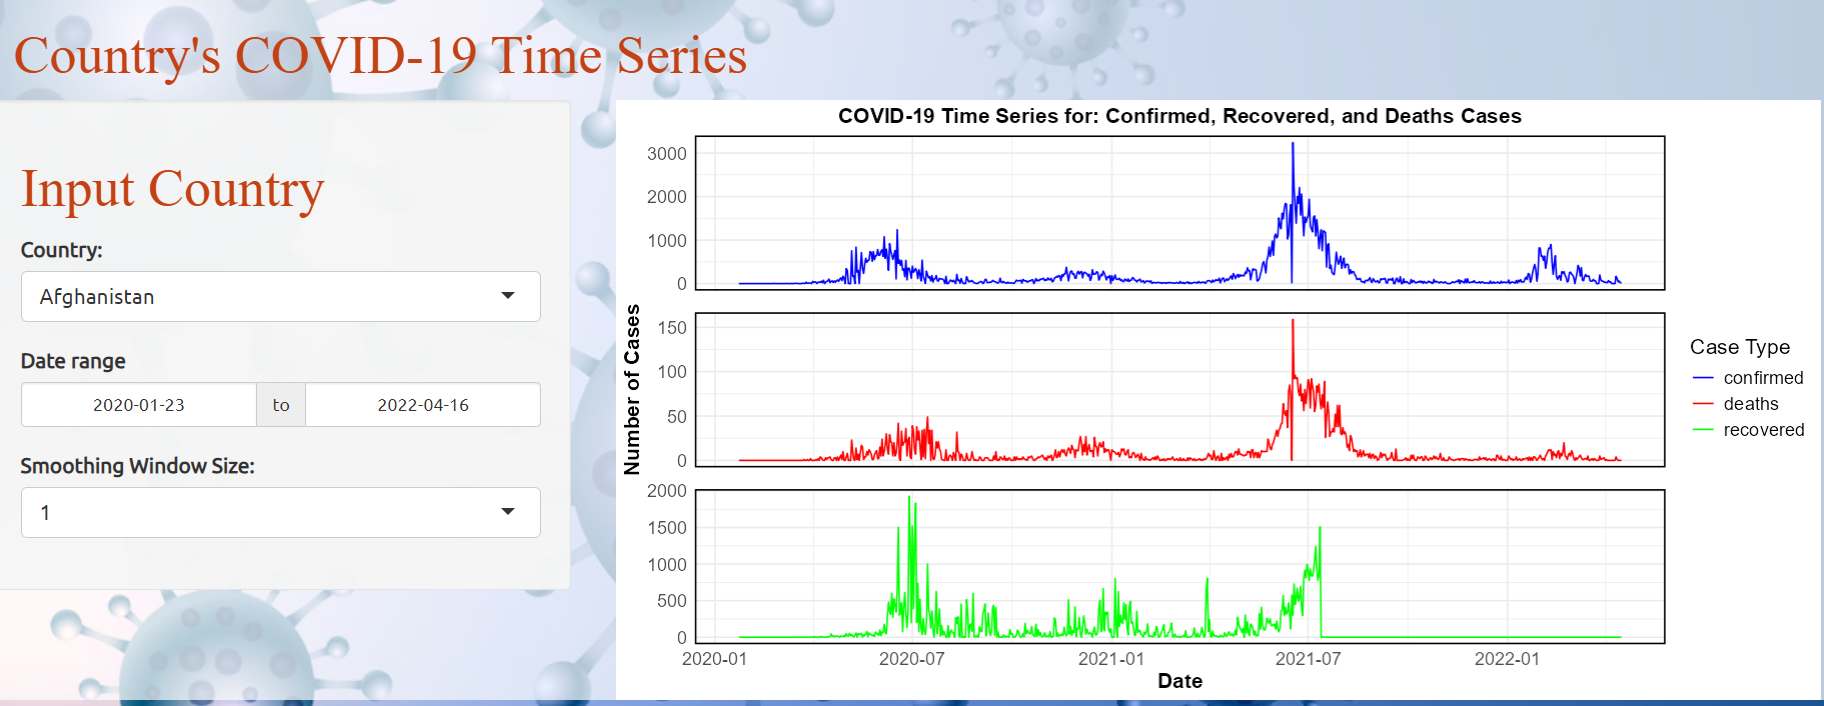
Time Series of Country’s COVID-19

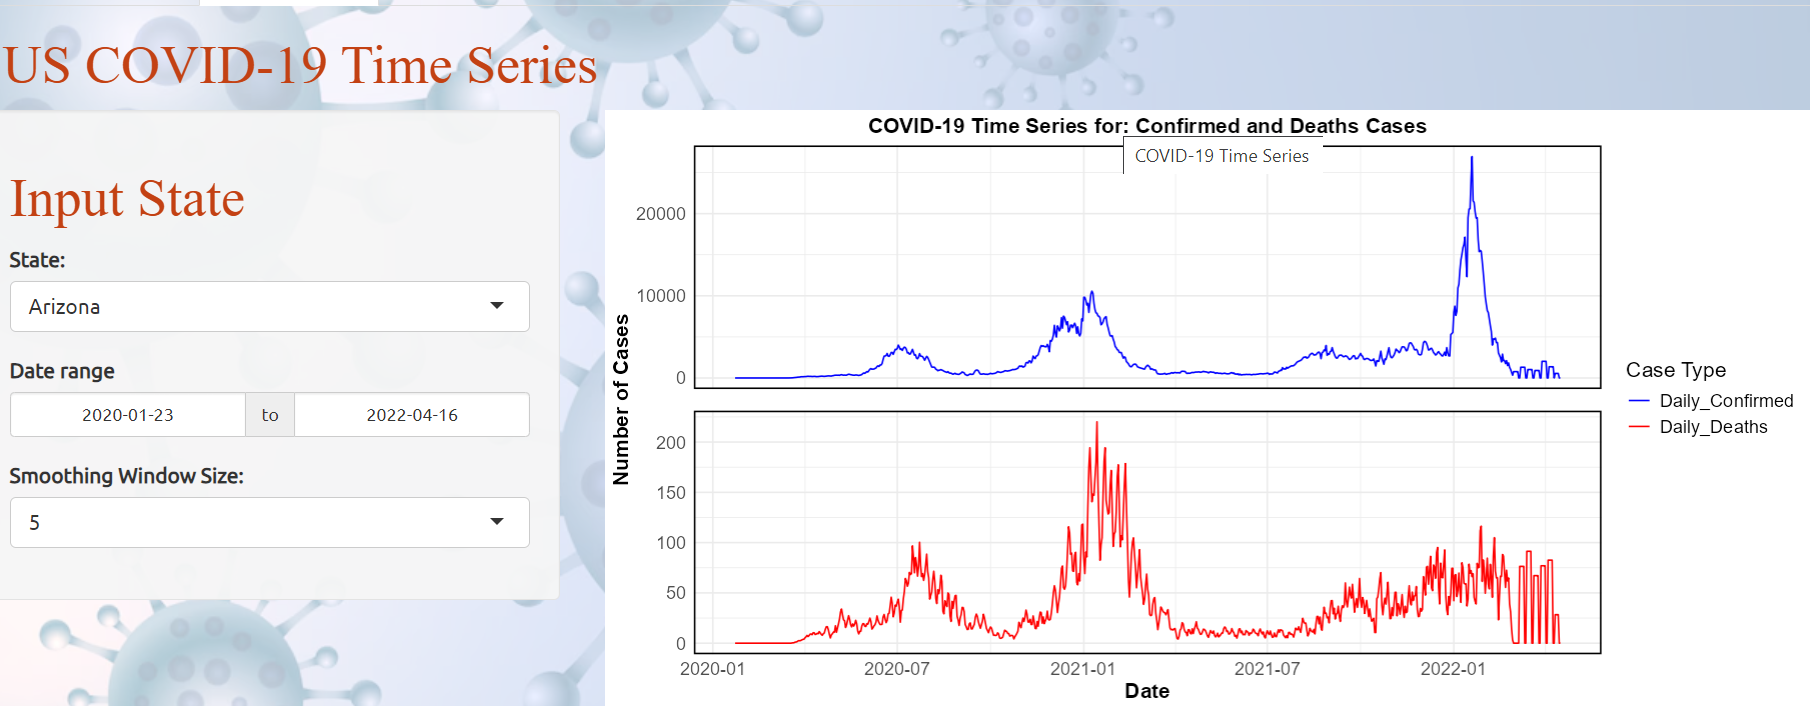
Time Series of US’s COVID- 19

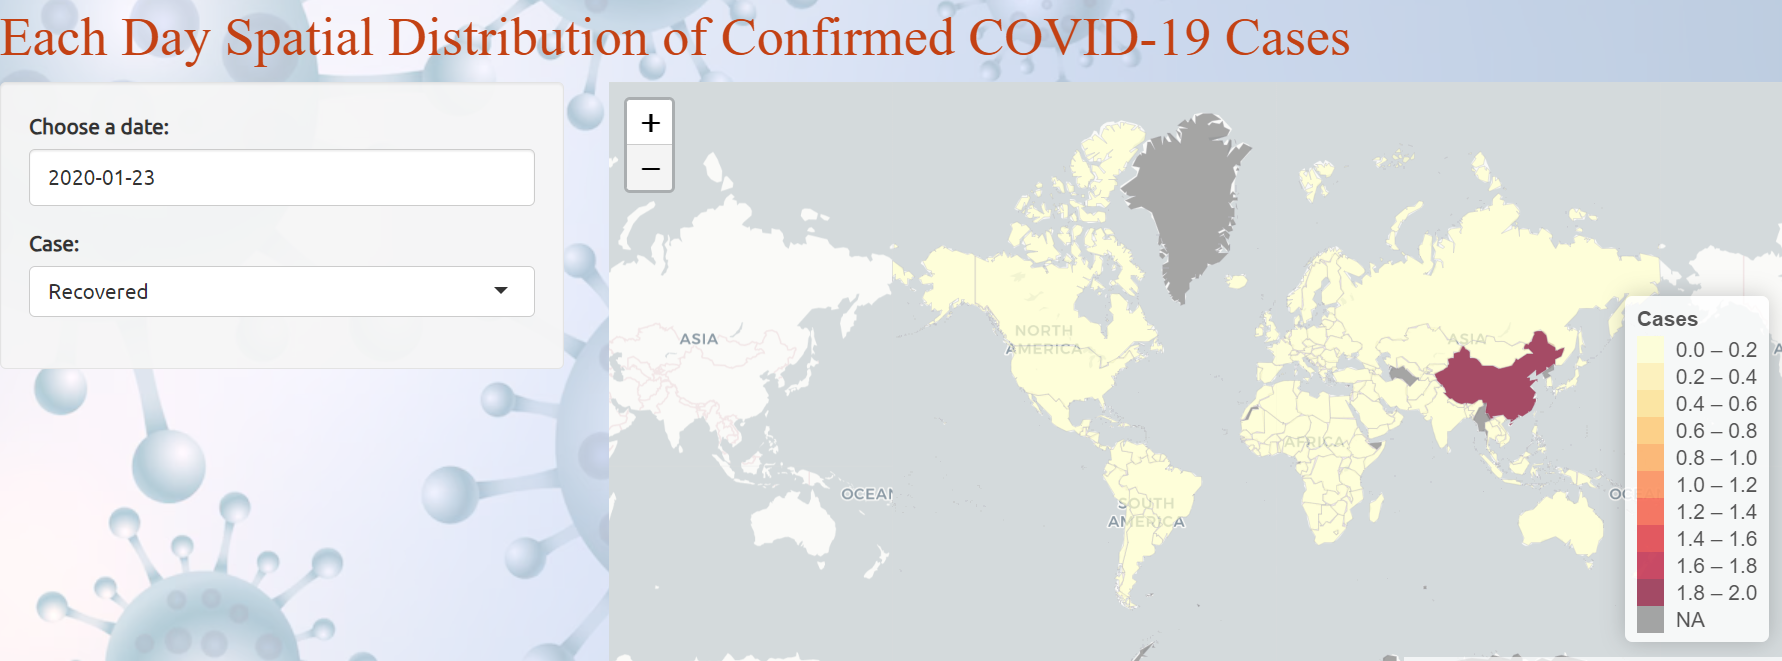
Spatial Distribution for Cases

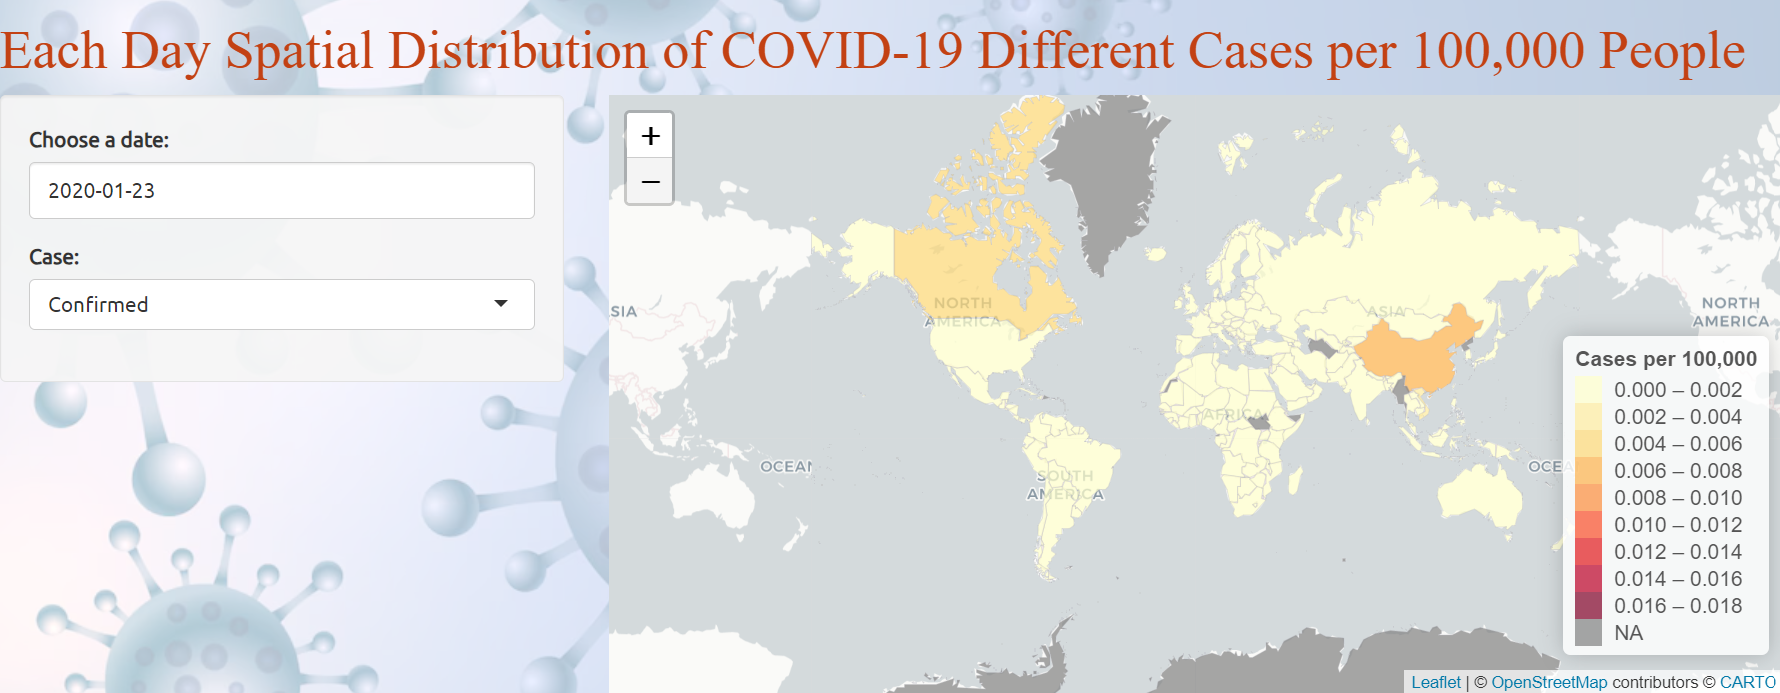
Normalized Spatial Distribution

Question -2

What is the relationship between total vaccinations and the reduction in active COVID-19 cases across different Counties?

Top - 10 Vaccinated Countries

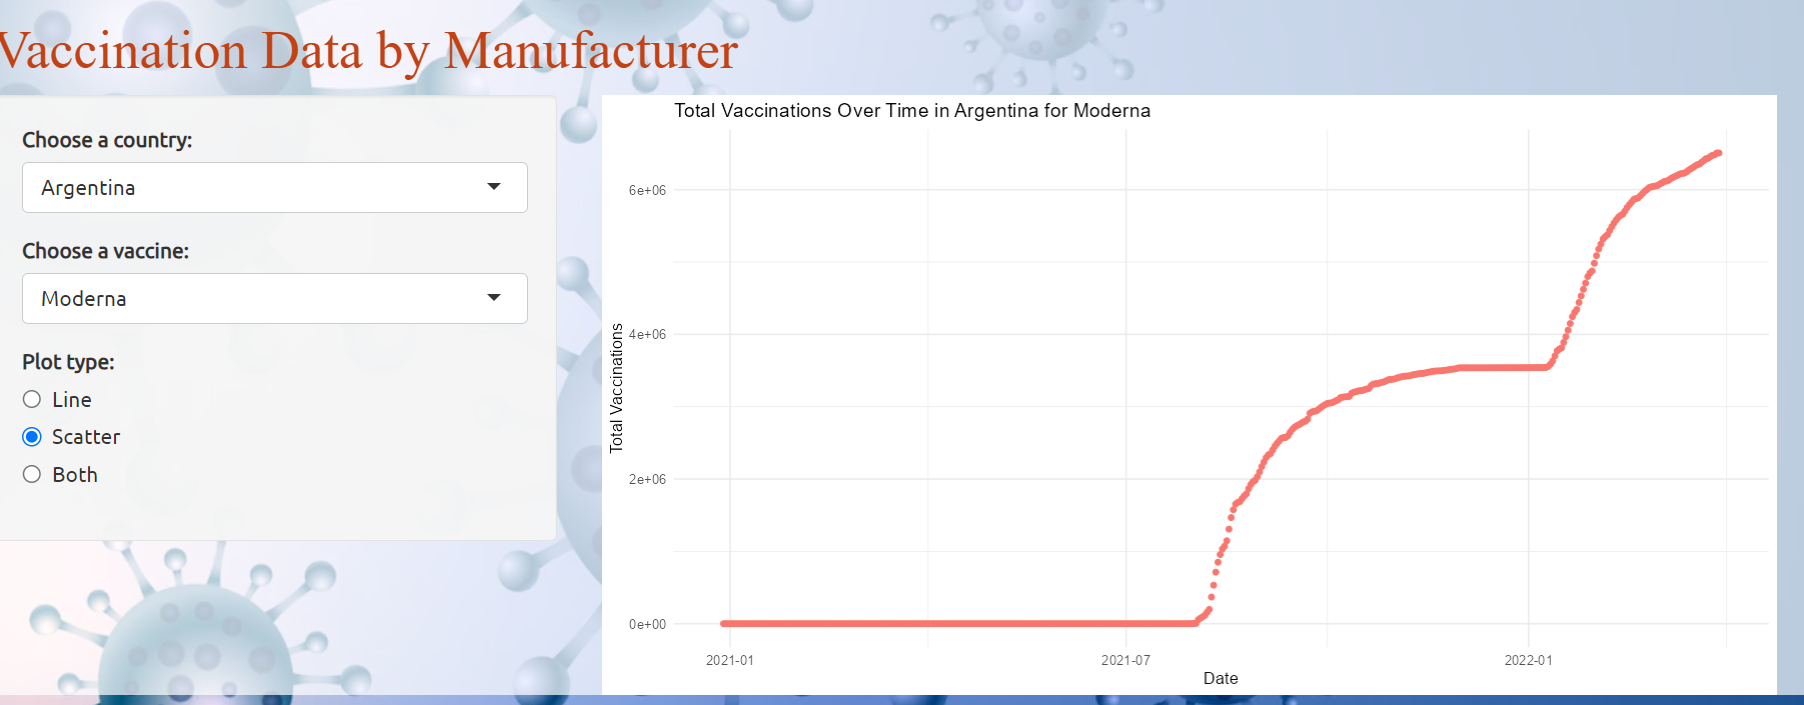
Time Series Vaccine Data by Manufacturer

Conclusion

  • Vaccination Impact: The sharp increases in vaccination, shown in the Argentina Moderna vaccine rollout, correlate with reductions in COVID-19 cases, highlighting vaccine effectiveness.
  • Spatial Analysis: Maps reveal variations in recovery rates and case numbers across regions, useful for targeted health interventions.
  • Per Capita Analysis: Normalizing data per 100,000 people allows for accurate comparisons across regions of different sizes, aiding in more effective response strategies.
  • Vaccination and Case Trends: Data from the top vaccinated countries shows that higher vaccination rates lead to fewer severe cases and deaths, underscoring the importance of continued vaccination efforts

Thank You for your time and attention during the presentation!