Analysis and Visualization of Police Shootings in the United States
INFO 526 - Spring 2024 - Project Final
Project Overview and Dataset
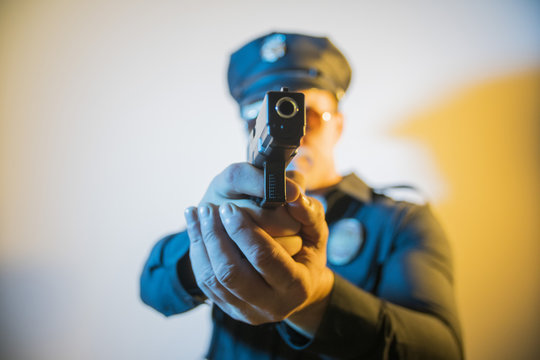
Police Shootings: An overview
- Police shootings are an unfortunate aspect of enforcing the law, as any loss of life is a tragic incident
- We aim to visualize and analyze police shootings in the United States from 2015 to 2017
- The data points were gathered on Kaggle and sourced from the Washington Post, so we are limited to their interpretation of what counts a as a police shooting
Data Summary with Dashboard
Question 1
How do socioeconomic factors such as median income, poverty rates, and education relate with incidents of police use of force?
Distribution of Threat Levels by Poverty Bracket

Distribution of Threat Levels by High School Pass Rate

Racial Shooting Density Across Median Income
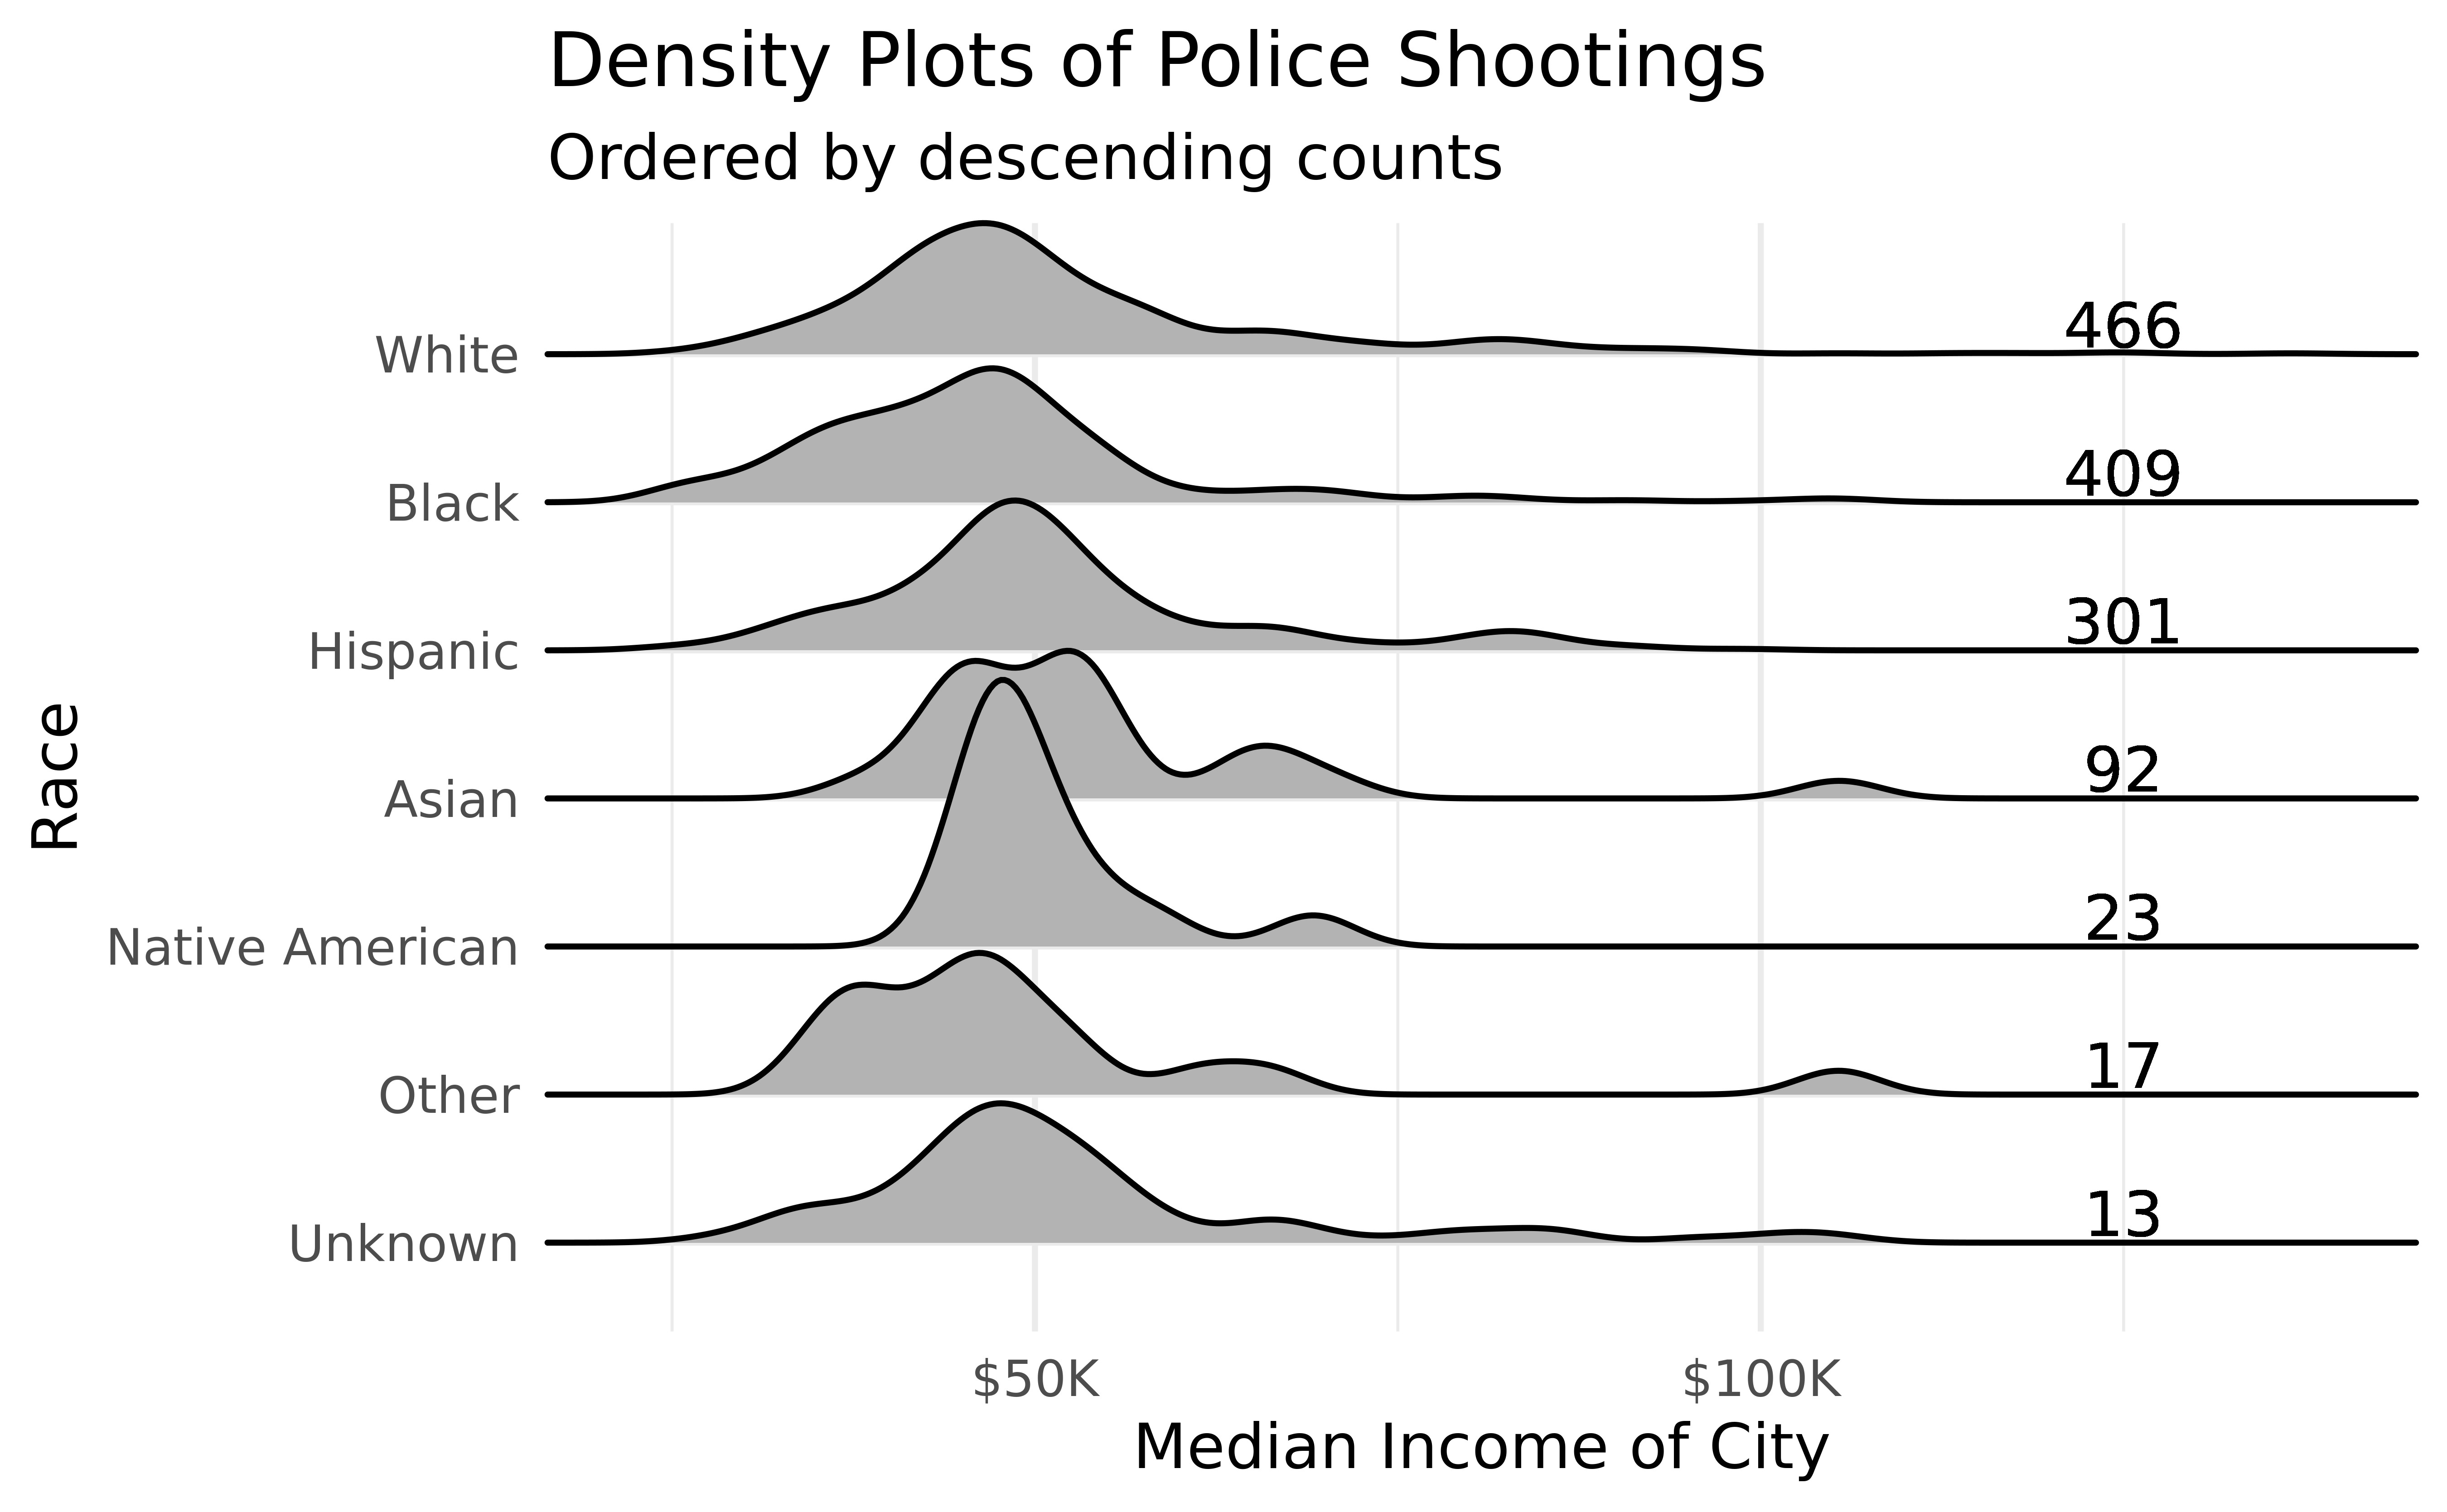
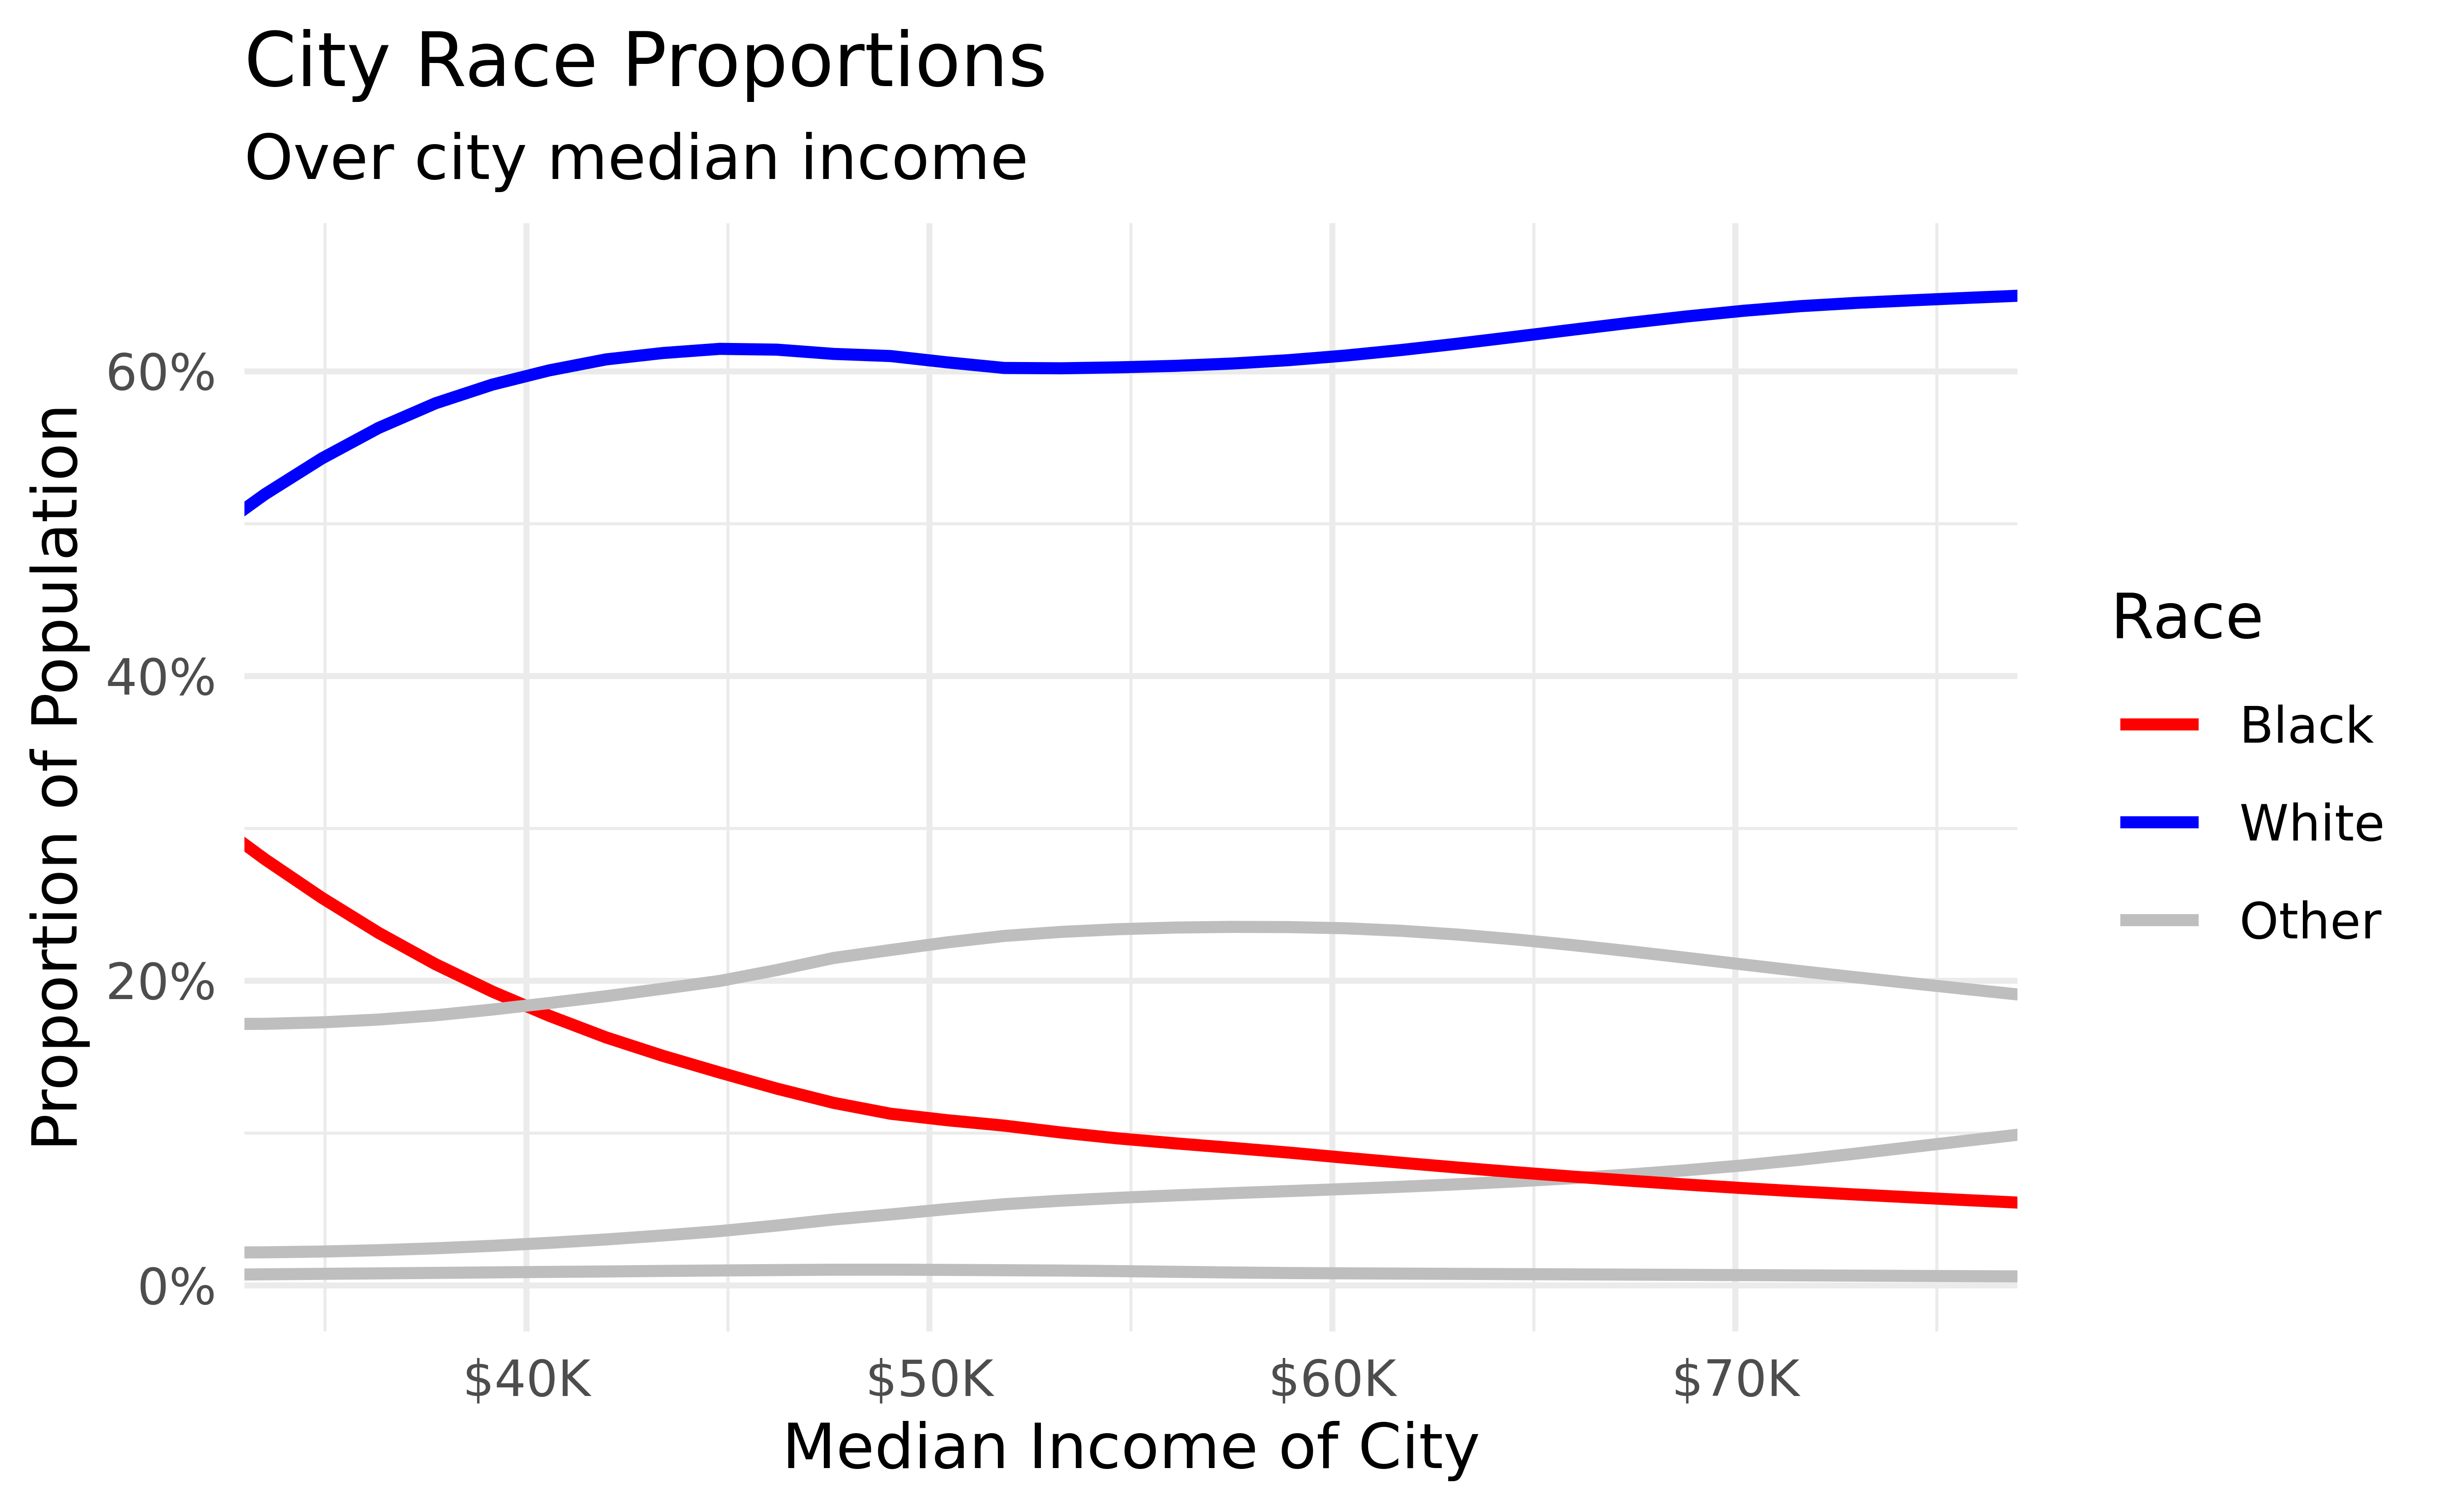
Median Insight
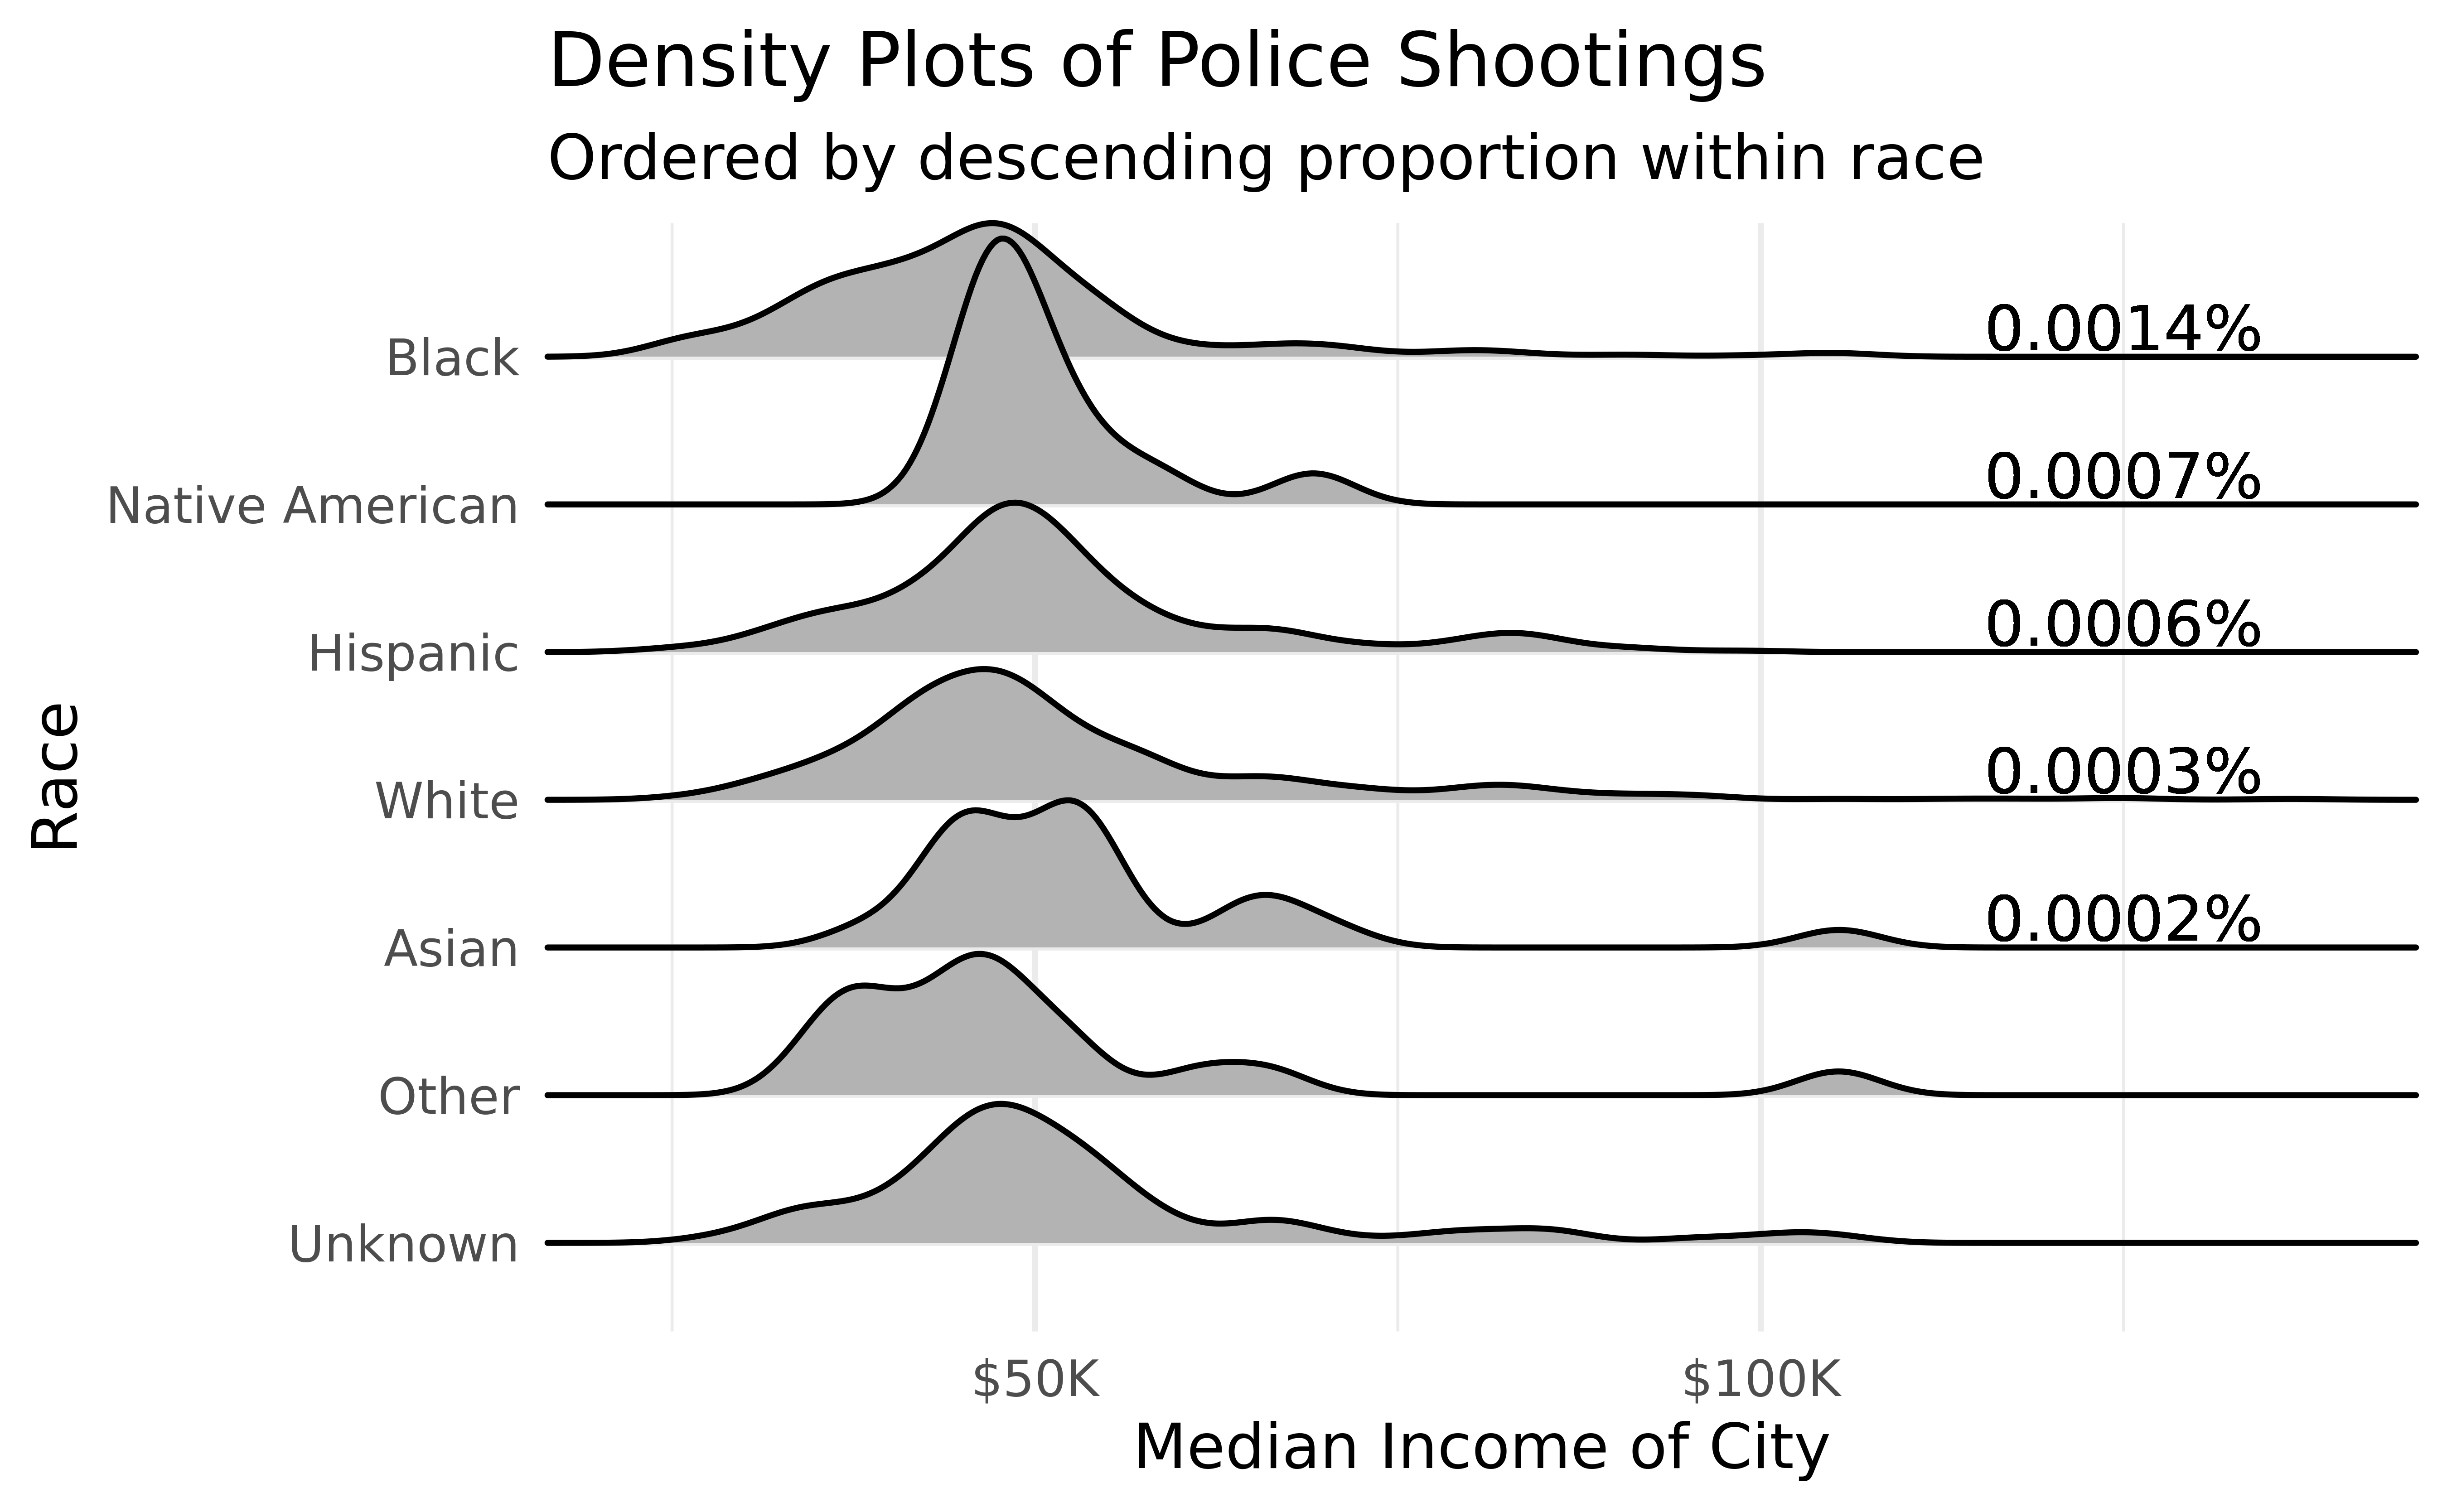
Adjusted Density Plots
Question 2
In what ways do the analyses of hotspot states, hotspot cities, and racial distribution contribute to understanding the intersection of incidents of police use of force across diverse geographic areas?
Analysis Approach
State and City Hotspots Analysis:
- Identifies regions and major urban areas with heightened police incidents using the shooting intensity metric, providing a nuanced understanding of localized dynamics.
- Utilizes shooting intensity per million people to highlight states and cities with high incidents.
- Incorporates custom annotation techniques to ensure clarity and comprehensive representation, including strategic labeling for Alaska on the maps.
Racial Intensity Heatmap:
- Applies the same shooting intensity metric per million people to highlight racial disparities in police incidents across states.
- Visualizes racial disparities in police incidents across states using color gradients.
- Utilizes transitions to illustrate evolving racial dynamics over the years.
Plot 1
Plot 2
Plot 3
Conclusion
Absolute fatalities:
Educational and Economic Factors: Cities with higher education levels (over 75% high school graduates) and moderate poverty rates (18-25%,~50K$) report the highest number of police shootings.
Racial Disparities: Despite white individuals having the highest count of being shot, black individuals are disproportionately affected when adjusted for population size. Black people are 4.7 times more likely to be shot by police compared to white people
Proportional fatalities (Per Million) :
- Geographic Variations: Urban centers and certain states display notably higher rates of police shootings, with significant variations in racial impact across different states and cities.
First Scenario Explains ‘what’ is happening and other is about ’how ’its happened