Global Trends in Cancer Mortality: A Shiny App Exploration (1990-2019)
INFO 526 - Spring 2024 - Project Final
INTRODUCTION
In the world of cancer research, there’s a lot of information to sift through. Researchers are left to sort through the abundance of new cancer-related data collected daily.
However, interpreting all this data to produce actionable insights that improve our understanding of and ability to combat cancer presents a significant challenge.
Join us as we employ visualization techniques to delve into the intricate patterns of cancer-related deaths and their wide-ranging effects on mortality rates across the globe.
Project Approch:
We will use Shiny app , allowing users to get insights and explore the data based on specific criteria (e.g., Country,Year).
We used Plotly to create an interactive world map that displays the percentage of the population affected by cancer.
We use Plotly and gganimate to create both static and dynamic visualisations that illustrate the rise in cancer from 1990 to 2019.
Causes of Death
The plot shows us various causes of death around the world from the year 1990 to the year 2019. Cardiovascular illness continues to be primary cause of death during the time period. It is closely followed by death by cancers.
Certain viral diseases, like lower respiratory infections, are on the rise again. This suggests a changing pattern that could be influenced by aging populations and climate change. The data might show improvements in immunization rates and healthcare accessibility that have led to benefits in some areas.
Death by Cancer

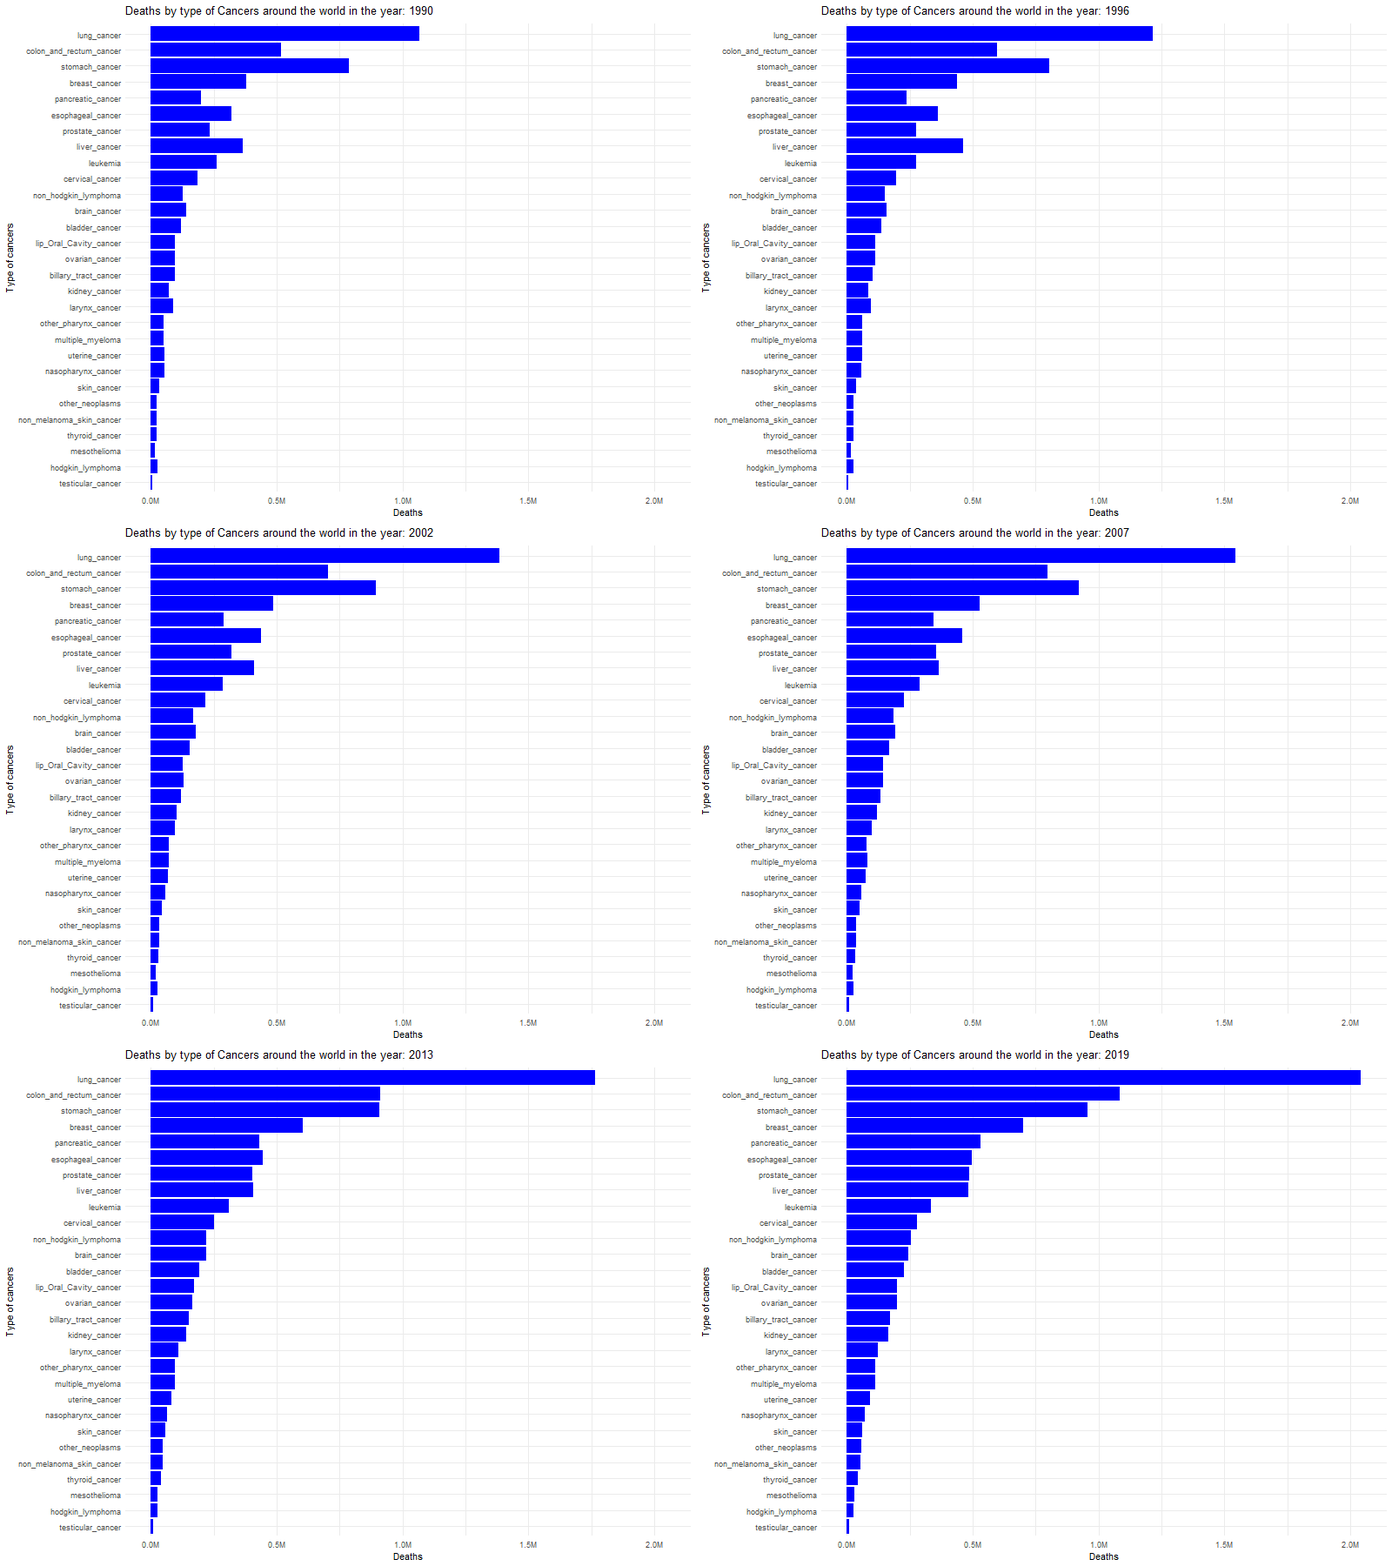
The plot showcases deaths by different types of cancers around the world over the time period 1990-2019. Lung cancer consistently dominates as the leading cause of cancer deaths globally, indicating a persistent and significant public health challenge over the entire period from 1990 to 2019.
Liver cancer exhibits an initial increase in mortality rates until the late 1990s, followed by a noticeable decline in the early 2000s, suggesting potential success in interventions or treatments targeting this specific cancer type.
Mortality rates due to stomach cancer remain relatively constant throughout the observed period, contrasting with the overall increasing trend seen in other cancer types, emphasizing the need for targeted research and interventions to address this specific cancer’s impact.
Cancer by Age Group
A notable inflection point is observed after the 2000s, particularly evident in the age group of 50-69 years, indicating a significant acceleration in mortality rates during this period.
Mortality rates in both the under 5 and 5-14 age groups show striking similarity, suggesting comparable vulnerability to cancer-related causes within these younger age brackets.
While both the 15-49 and 70+ age groups exhibit a consistent upward trend in mortality rates, they converge around 2010. However, following this convergence, the 70+ age group experiences a rapid increase, surpassing the 15-49 age group, highlighting the disproportionate burden of cancer-related mortality among older populations.
Death Rate by Age Group

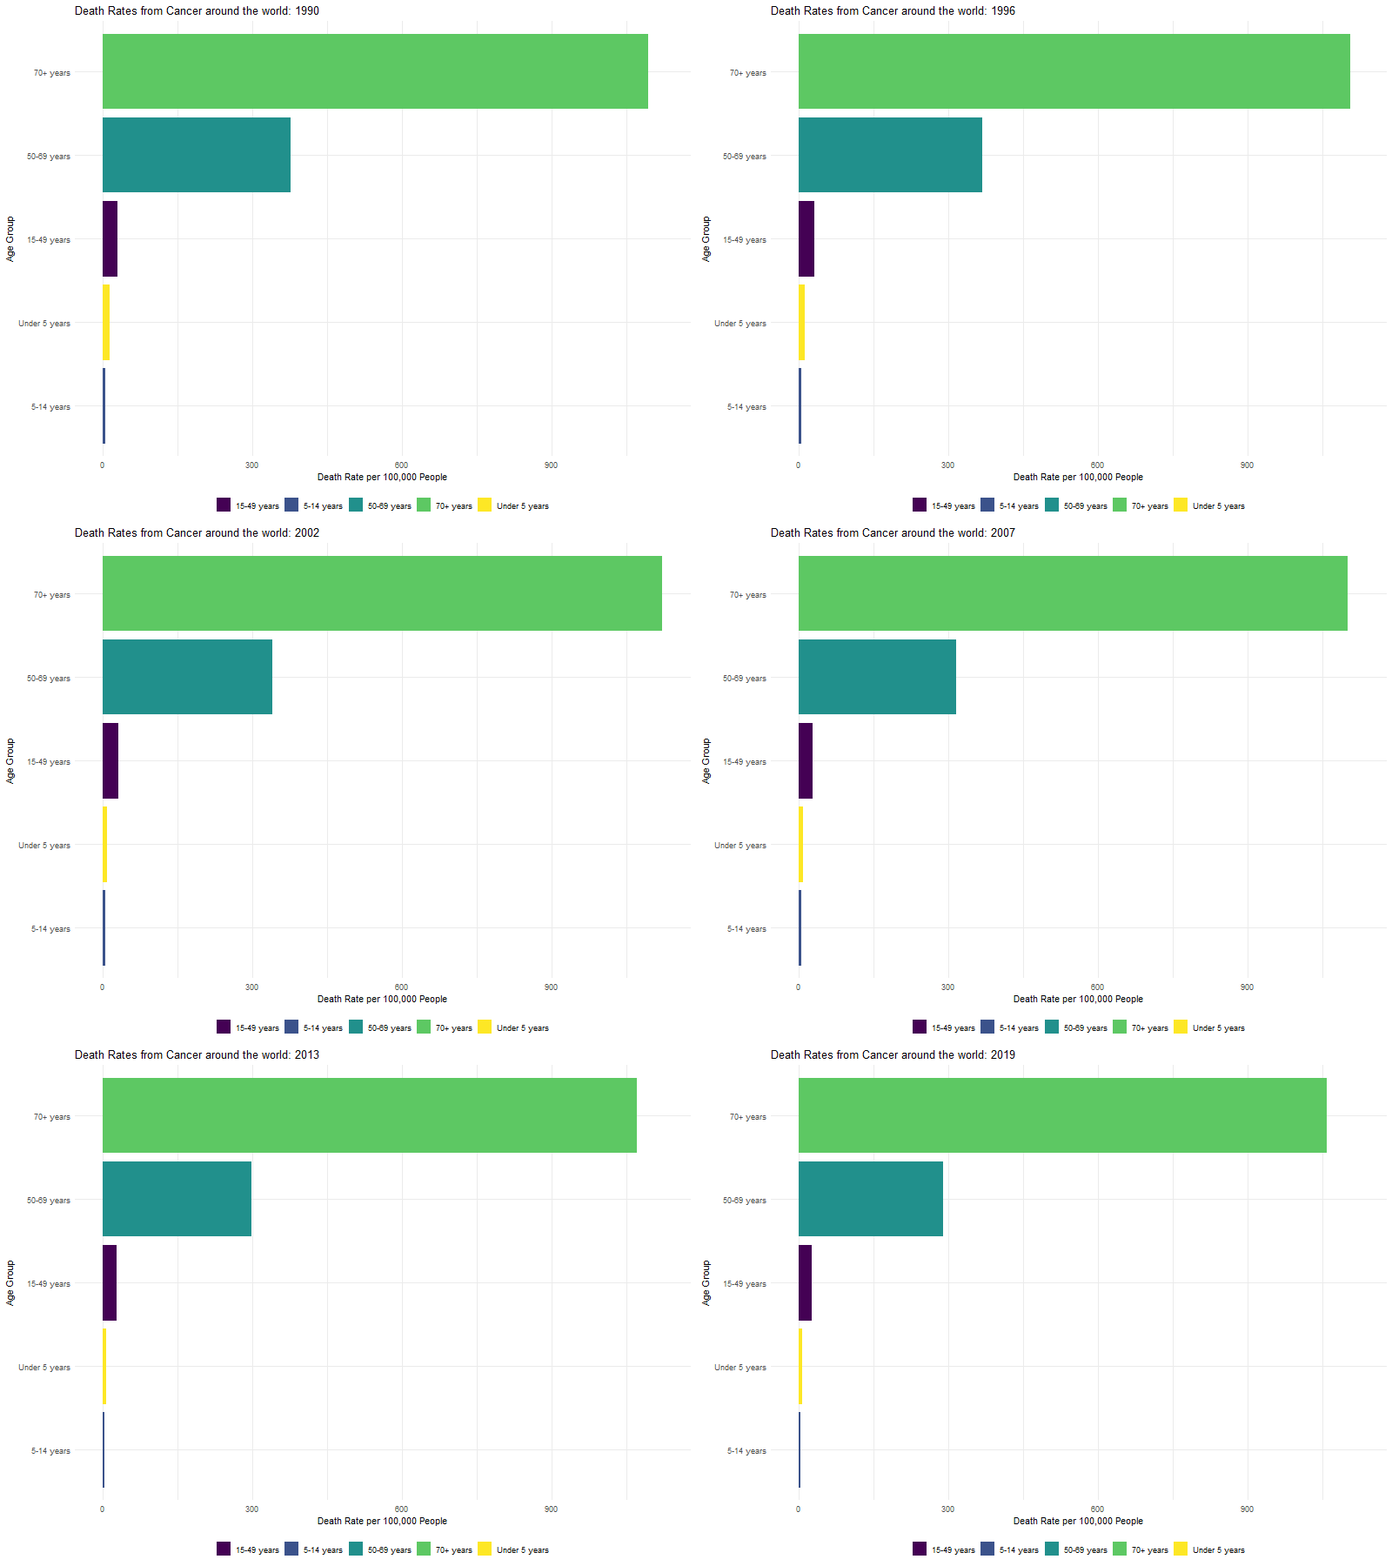
Over the period spanning from 1990 to 2019, the 70+ age group emerges as the demographic with the highest contribution to cancer-related mortality, surpassing all other age groups.
Notably, beginning from the early 2000s, both the 50-69 and 70+ age groups exhibit a discernible decline in mortality rates, signaling a positive shift in the trend of cancer-related deaths within these older age groups.
Cancer Count per 100 People
Over the observed period, the death rate due to cancer has climbed from 20 deaths per 100 individuals to 25 deaths per 100 individuals globally.
Notably, countries such as Canada and America have witnessed a significant surge in their death rates, nearly doubling compared to the initial figures, thereby reaching approximately 8-9 deaths per 100 individuals.
Conversely, India has experienced a much milder increase in death rates, with figures remaining relatively low, around 5 deaths per 100 individuals, indicating a notable disparity compared to Western countries.
Romania exhibits a consistent death rate, hovering around 17 deaths per 100 individuals throughout the observed period, suggesting a stable trend amidst fluctuating global patterns.
Shiny App Link
Conclusion
Leading Causes and Interventions: Lung cancer remains the primary cause of death globally, while declines in liver cancer mortality post-2000s suggest intervention successes. Stable mortality rates due to stomach cancer call for targeted research and interventions.
Global Increase in Cancer Mortality: Overall, there’s been a worrying rise in cancer-related deaths worldwide, with rates climbing from 20 to 25 deaths per 100 individuals.
Regional Disparities: Canada and America have seen a significant surge in death rates, reaching nearly 8-9 deaths per 100 individuals, contrasting with India’s lower rate of around 5 deaths per 100 individuals.
Age Group Dynamics: The 70+ age group is most vulnerable, but positive shifts in mortality rates among older age cohorts suggest progress in prevention and treatment.
Inflection Points: Since the 2000s, notable variations in mortality rates suggest significant changes in disease dynamics, highlighting the importance of advancing treatment procedures and research in the medical field.
References
- Title background image: https://www.htworld.co.uk/news/research-news/injectible-gel-developed-to-deliver-cancer-drugs-for-solid-tumours/
- Taken reference for shiny from : https://shiny.posit.co/r/getstarted/build-an-app/reactive-flow/ui-inputs.html
- Datasets taken from: https://ourworldindata.org/cancer

