Meteoric Fall: a comet-ment to data
INFO 526 - Spring 2024 - Project Final
Viz Wizards - Nick Ferrante, Jeremiah Gaiser, Tanya Evita George, Mrunal Jadhav, Jasdeep Singh Jhajj, Gillian McGinnis, Agastya Deshraju
Introduction
- This project aims to understand how meteorites impact historical events and celestial phenomena using data visualizations.
- A Shiny app has been made to visualize data, focusing on animated timelines, static maps, leaflet maps, and custom maps to analyze where meteorites land and their historical and celestial contexts.
Understanding the Dataset
- The data set Meteorite_Landings.csv, has been sourced from NASA’s Open Data Portal.
- The dimensions include 10 variables i.e. 6 numerical and 4 categorical variables.
Question 1
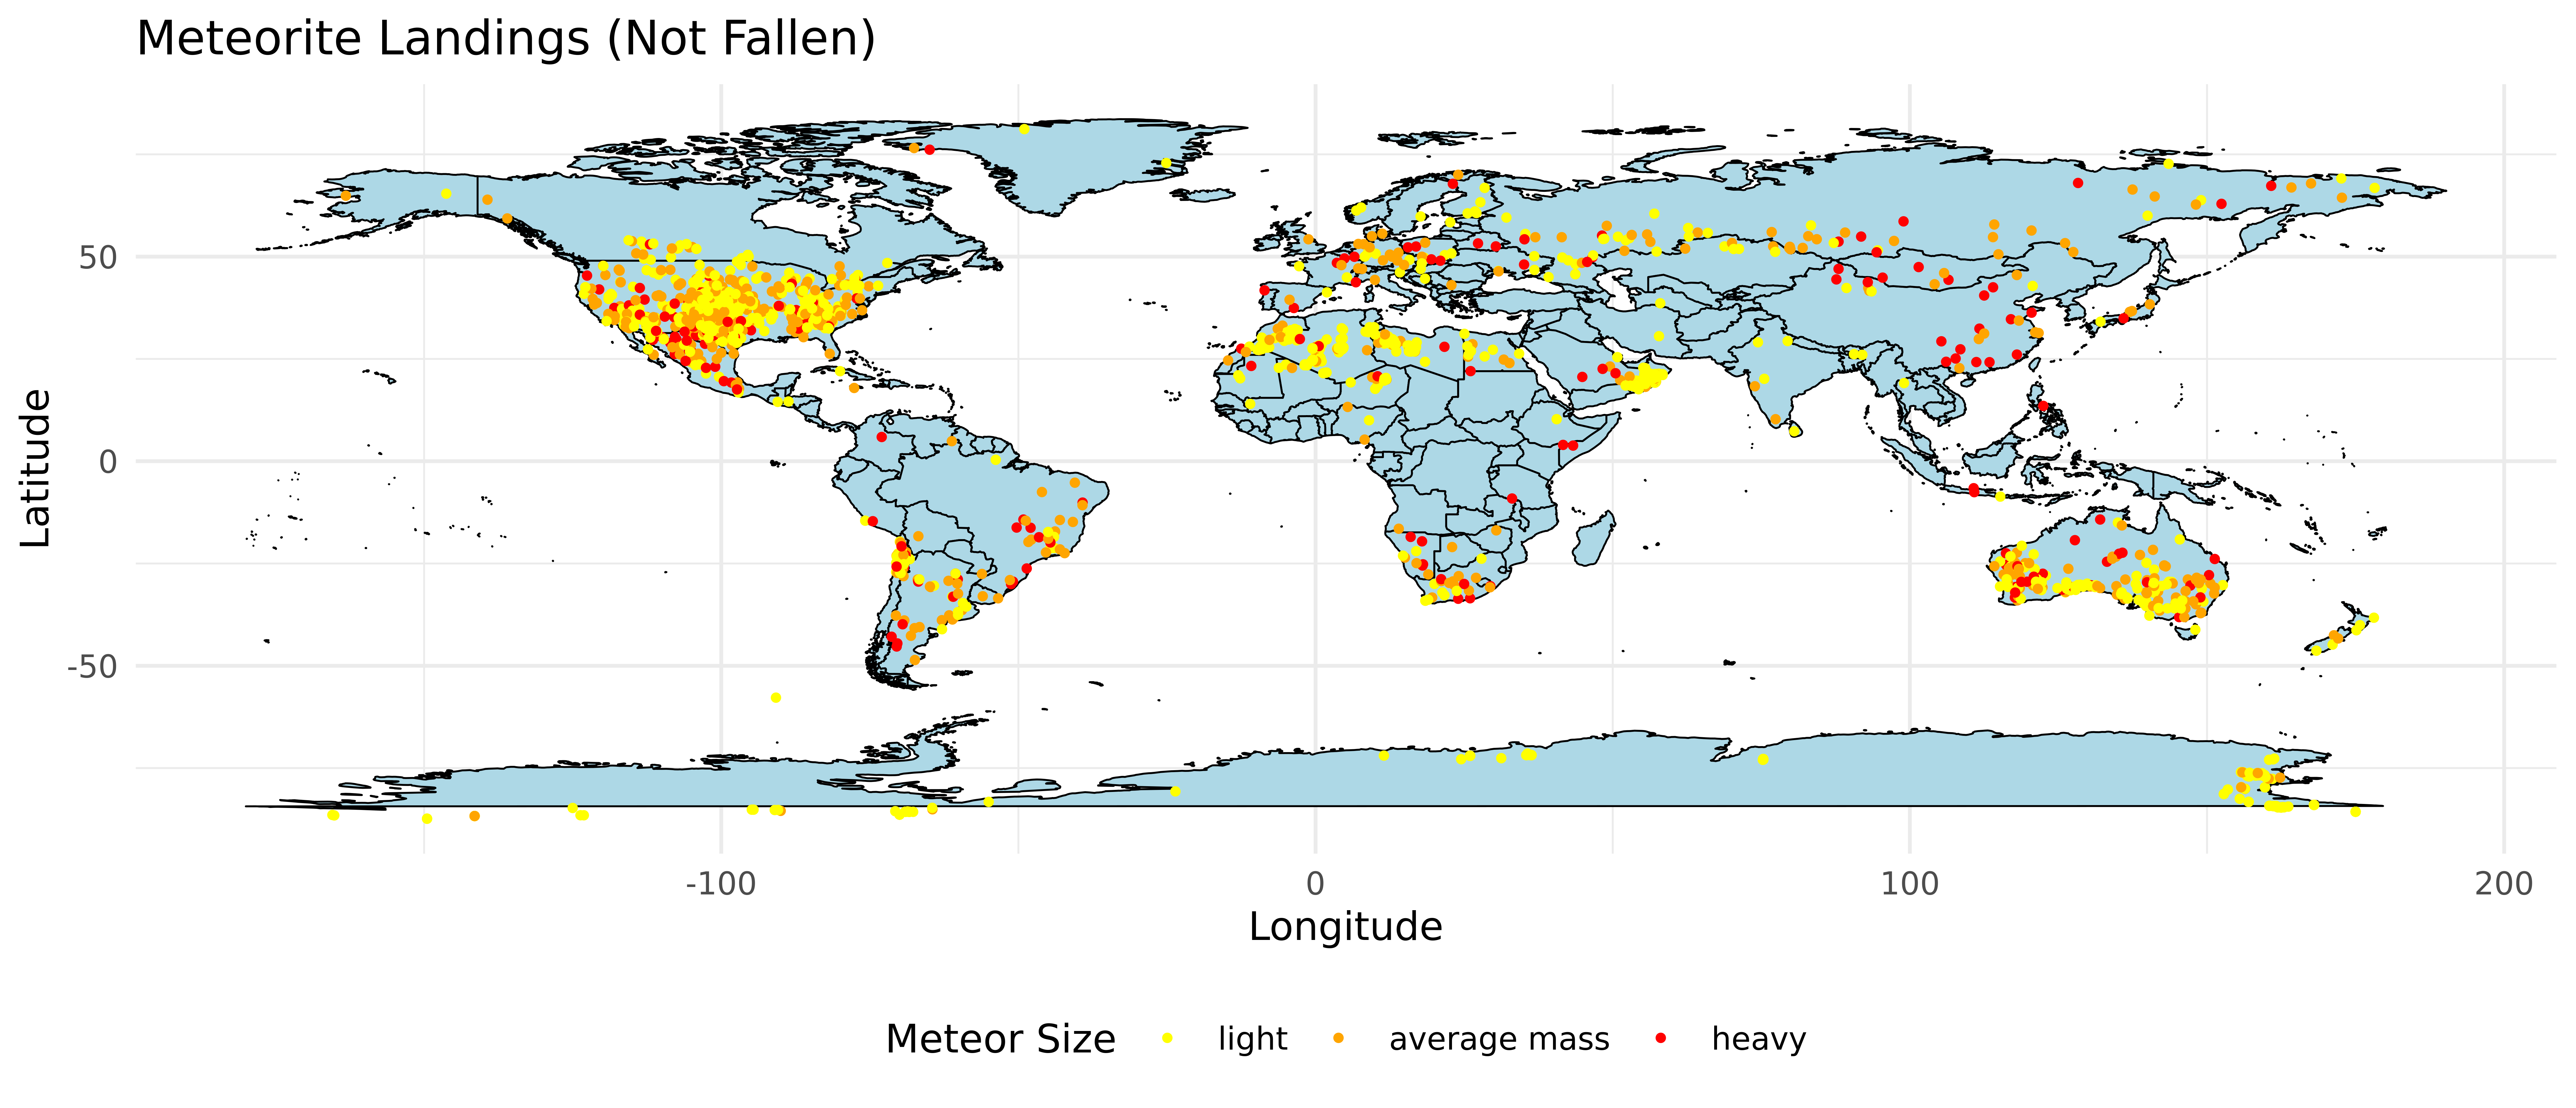
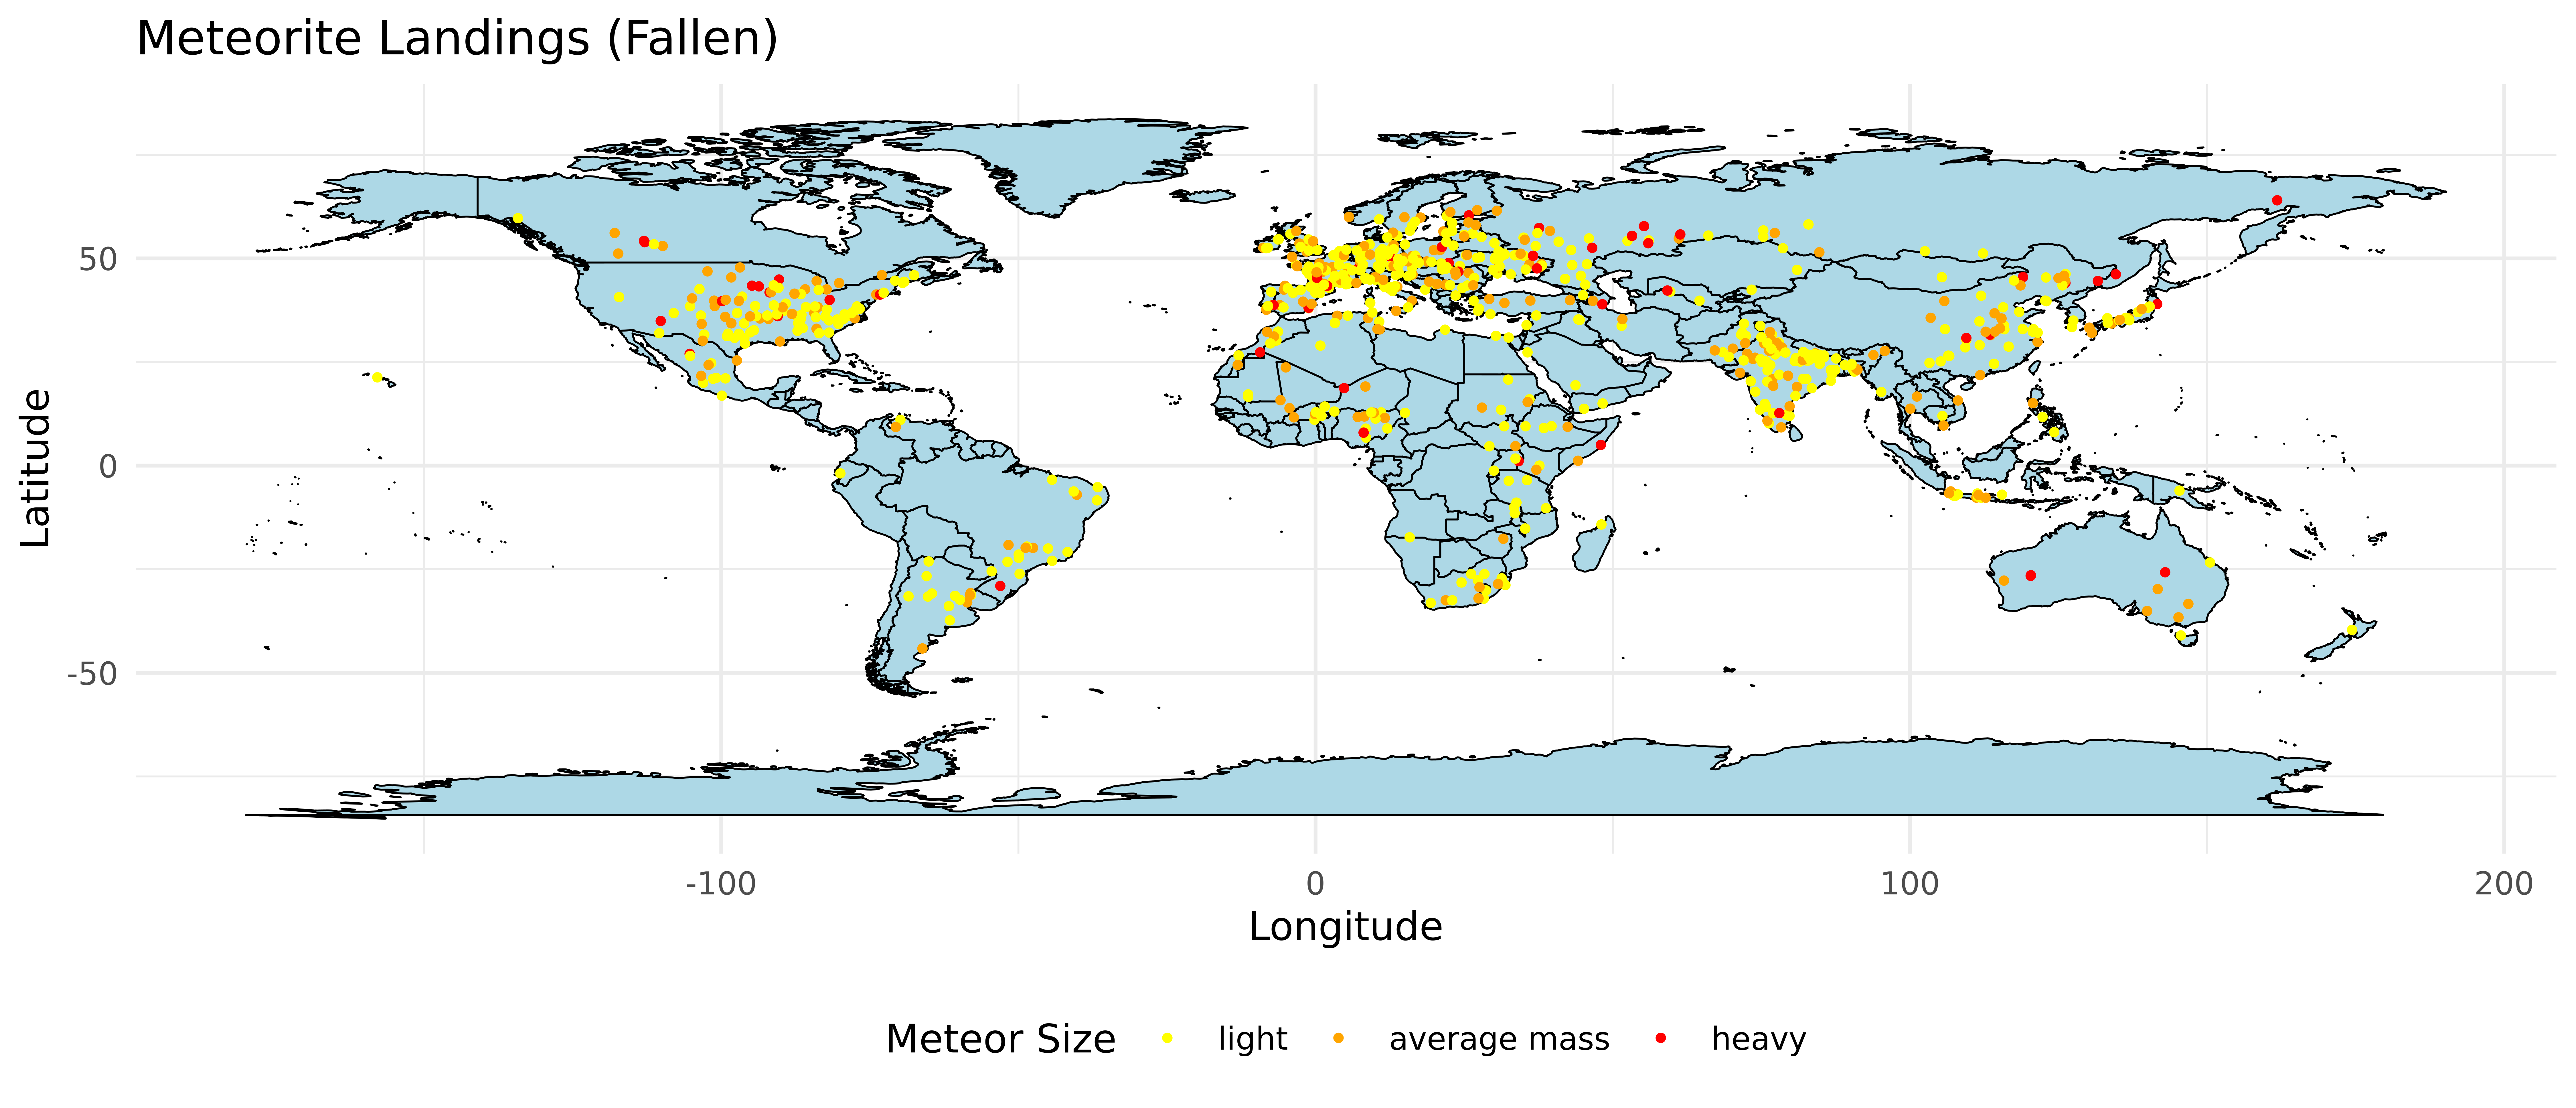
What does the distribution of meteor impacts look like across the earth? - Which continents have accumulated the most total mass of meteors?
Meteorites recorded before and after falling
Insights
- The top 2 locations of the heaviest meteors that fell were reported to be near the Kazakhstan border along Russia and in parts of USA.
- Only the USA and a majority of Australia seem to have the maximum recorded visuals of meteors in the whole world.
- It is also surprising to note that while a lot of meteors were sighted in the USA, there was almost a negligible count of sightings recorded in its neighboring country, Canada.
- The country with the maximum number of sightings of fallen meteors is India and the continent with most sightings of meteors before falling is Europe.
Leaflet Plot for Fallen Meteorites
- The map allows you to explore meteorite sightings across the entire world showcasing clustered concentrations in certain regions.
- By clicking on individual meteor markers on the map, you can access detailed information about each meteorite(year it fell, its mass, its classification and position)
- The continents that have accumulated the most total mass of meteors are Europe and Asia.
Question 2
How do historical events relate to the observations and discoveries of meteors?
Question 2 - Plots
Time Series of Meteor Observations by Year
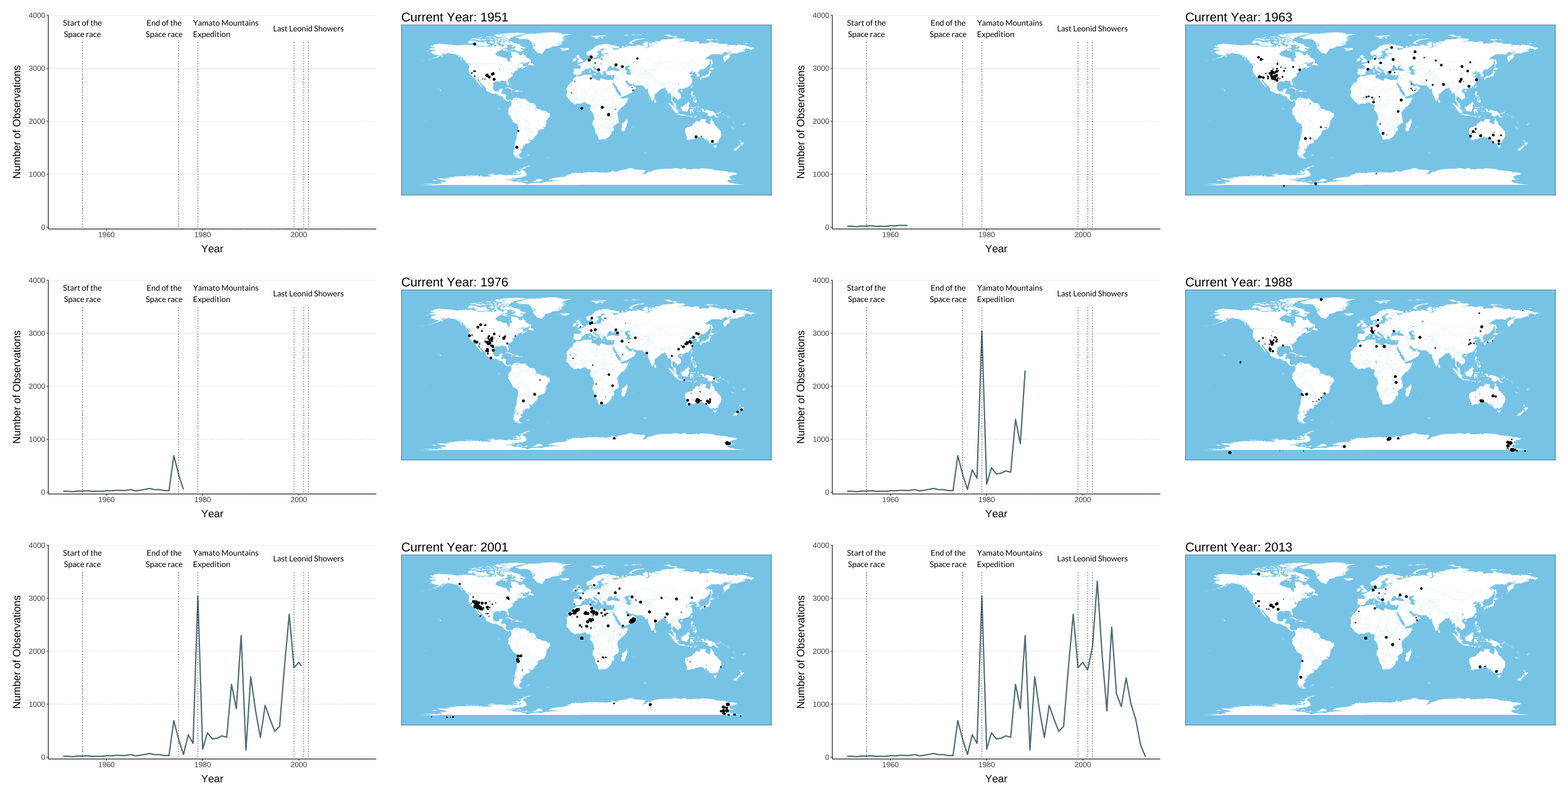
- Only slight increase in observations towards the end of the Space Race
- Huge spike resulted in observations resulted from the Yamato Mountains Expedition
- Also a large spike during and after the last Leonid showers
- It does in fact seem to be the case that an increase in observations follows meteor showers
Question 3
Are trends observed in frequency, type, or location of meteors, related to known celestial events?
Shiny Asteroids
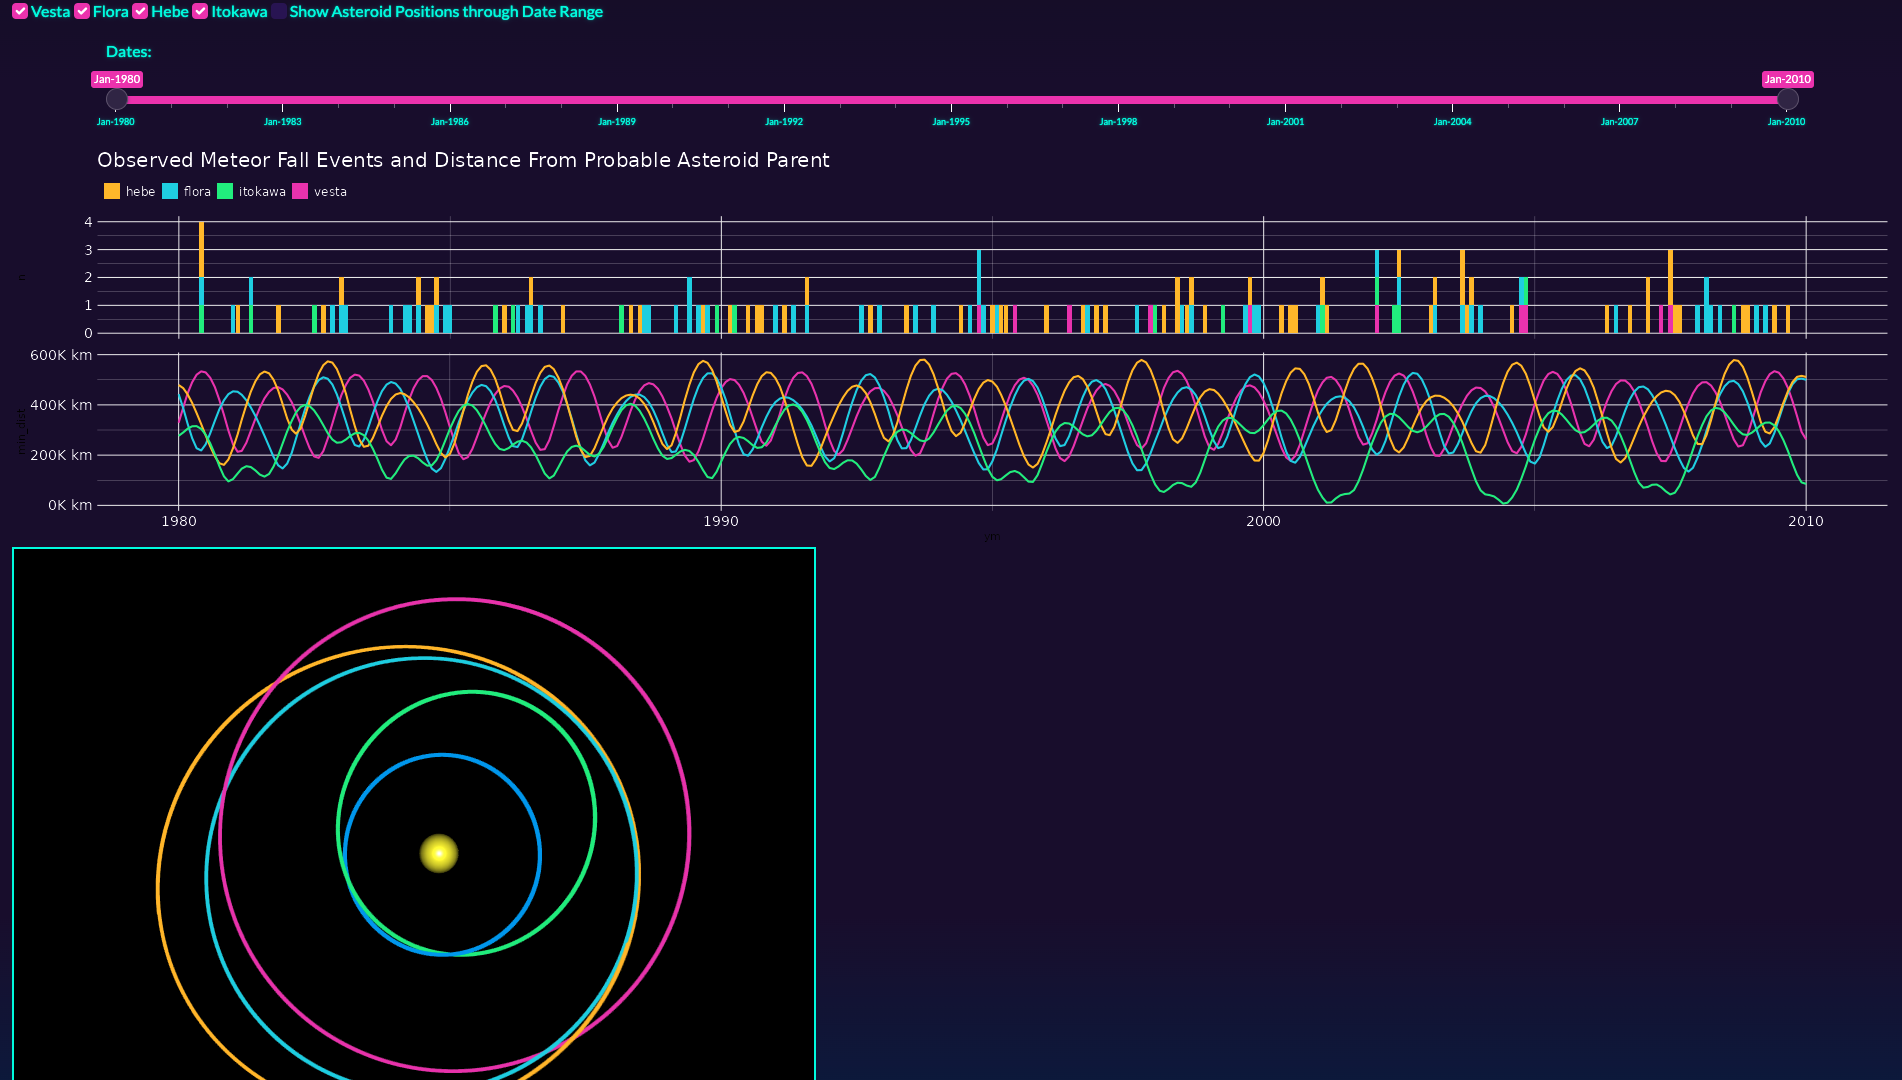
Shiny Meteorites
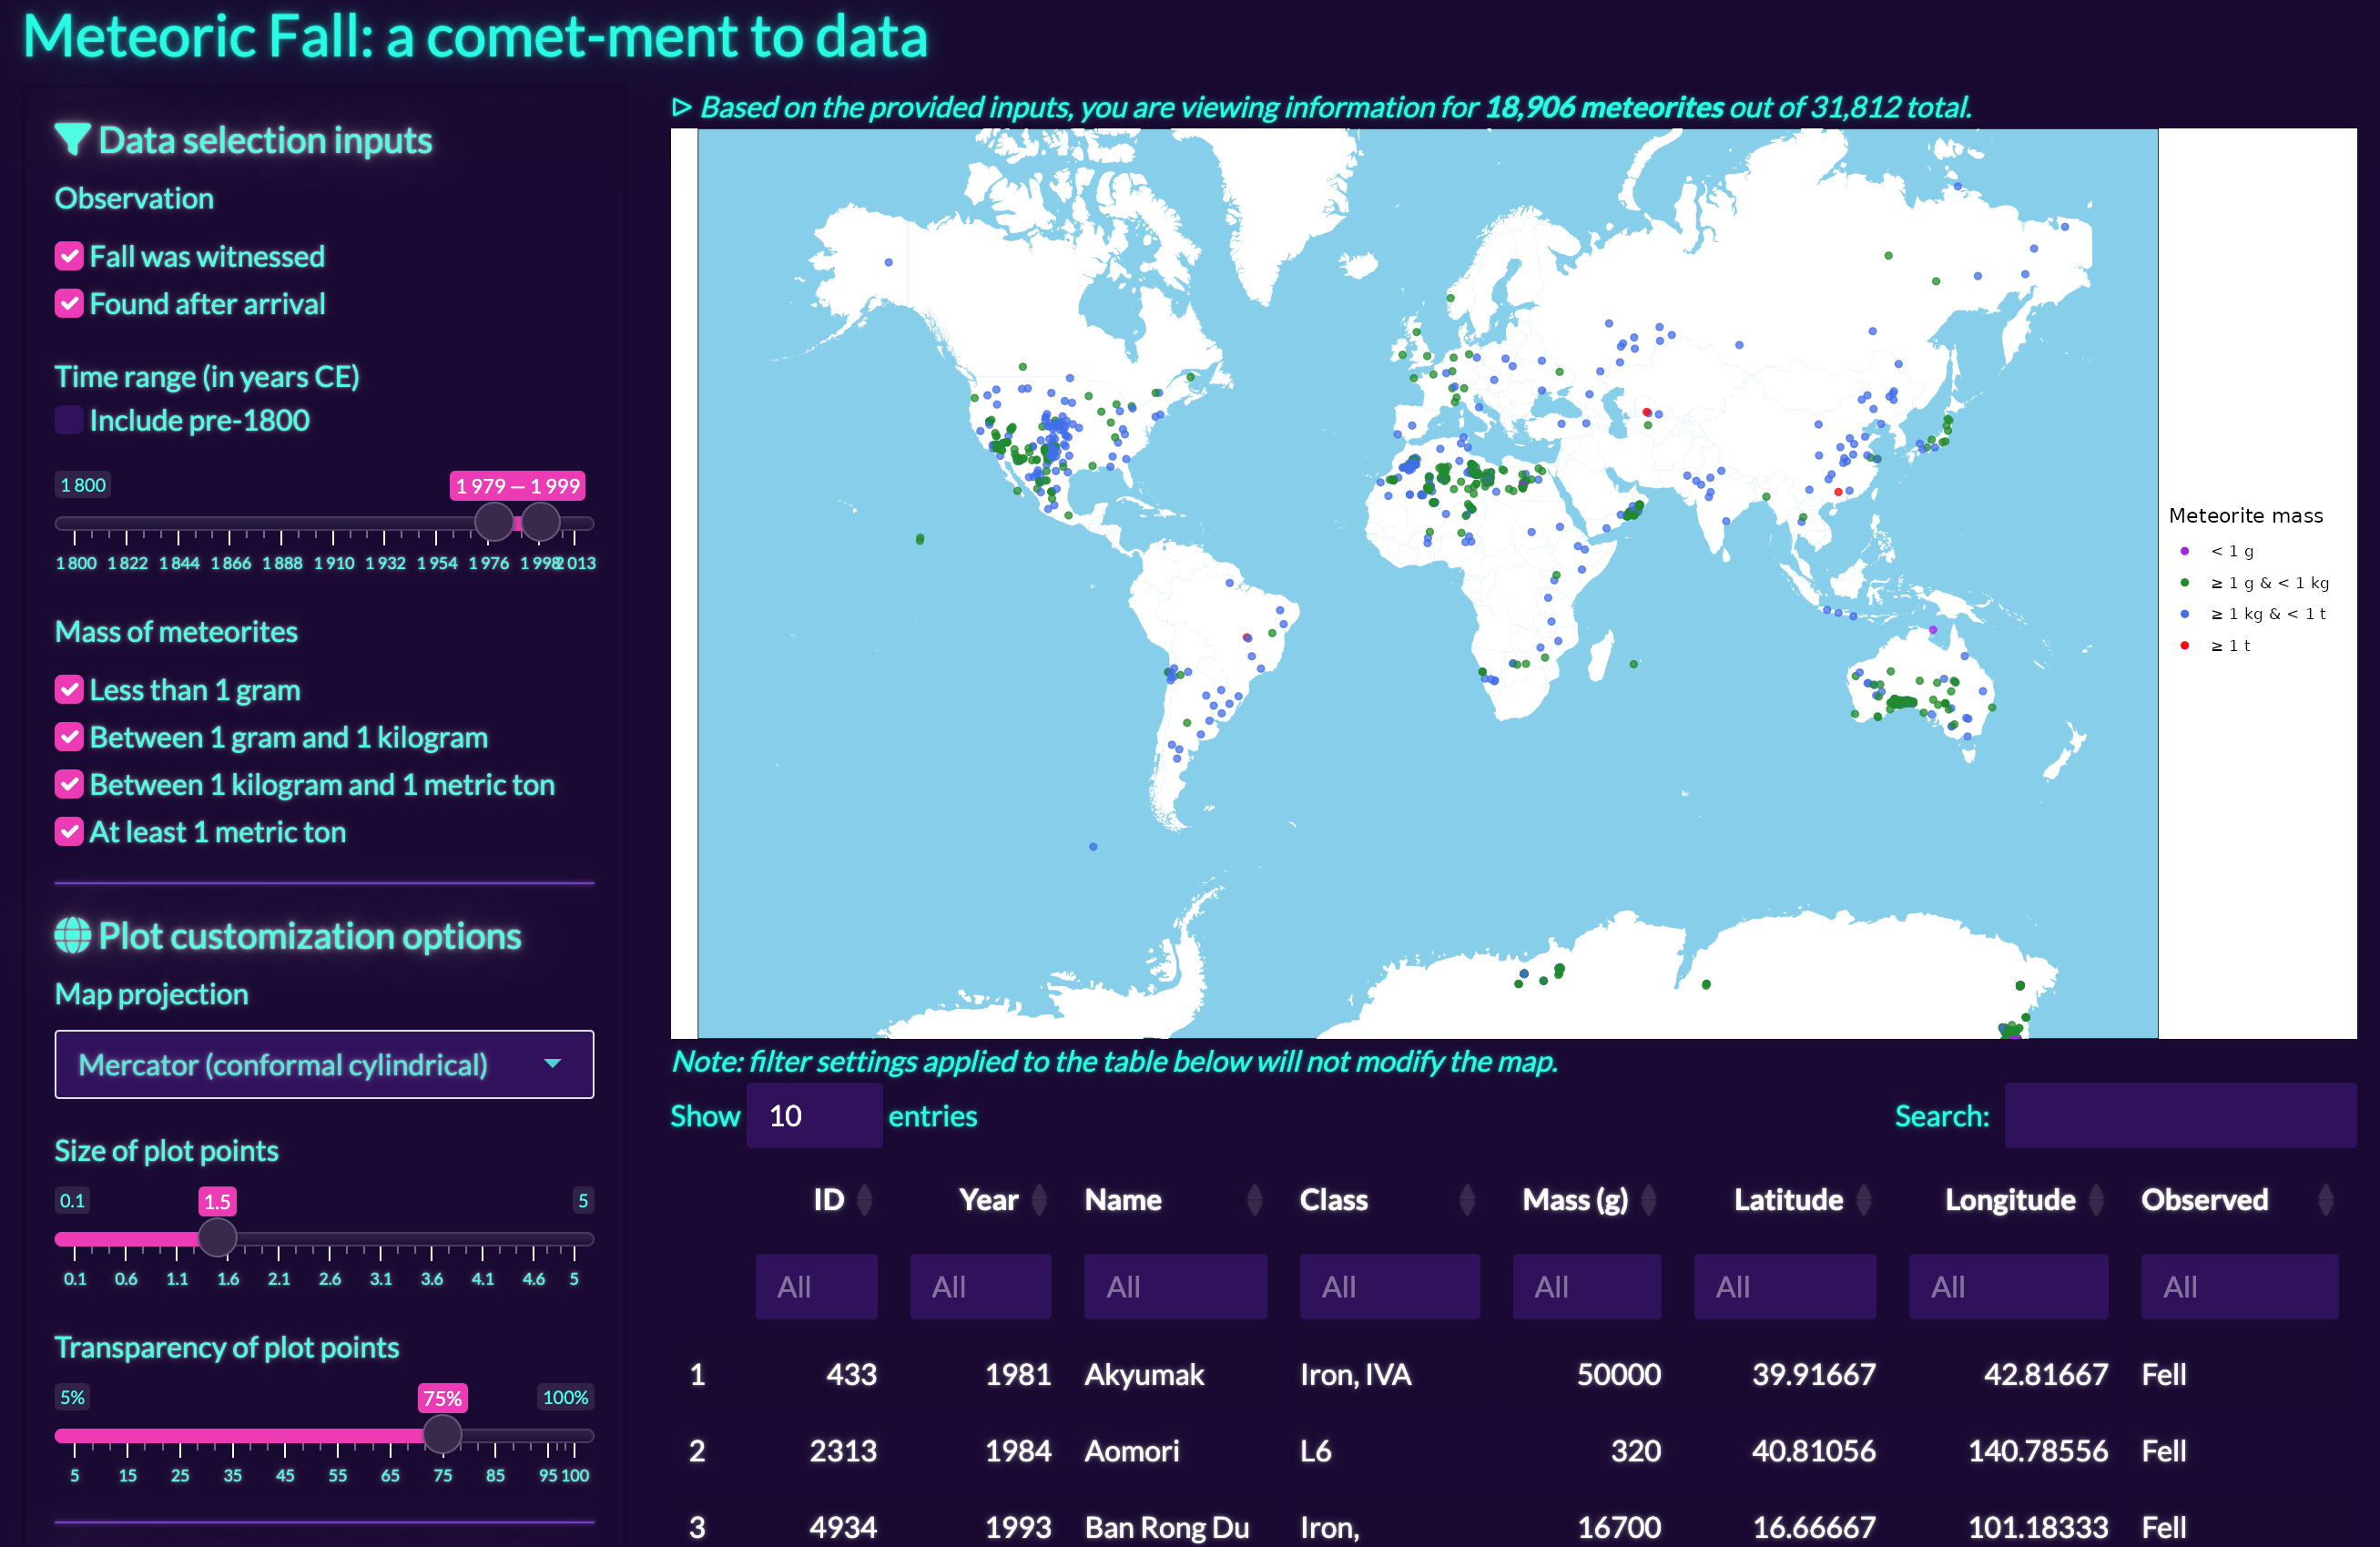
Conclusion
- Created an easy-to-use platform using Shiny app technology, making it simple for anyone to explore and visualize meteorite data.
By analyzing historical data, we aim to visualize historical meteorite impact sites, potentially aiding decision-making processes and scientific discussions.
Our goal was to make meteorite research accessible to everyone, fostering curiosity and understanding in fields like geology and astronomy.
